Difference between revisions of "Procedure for Capillary Electrophoresis with C4D"
(→Equipment Required) |
(→Procedure) |
||
| Line 67: | Line 67: | ||
# Click Stop, in the Manual Sampling box, when you have collected all of your peaks. | # Click Stop, in the Manual Sampling box, when you have collected all of your peaks. | ||
# Repeat steps 15, 16 and 17 for each blank, calibration standard and sample you wish to analyse. | # Repeat steps 15, 16 and 17 for each blank, calibration standard and sample you wish to analyse. | ||
| − | # Analyse the data, by integrating the peaks and drawing a calibration graph, as shown in the PowerChrom software | + | # Analyse the data, by integrating the peaks and drawing a calibration graph, as shown in the PowerChrom software [https://www.edaq.com/edaq-product-manuals manuals] and the [https://www.edaq.com/wiki/Screencast_Training_Videos#PowerChrom screencast training videos] |
== Results == | == Results == | ||
Revision as of 12:07, 30 May 2018
A procedure for capillary electrophoresis with C4D detection using the PowerChrom software is described.
Introduction
This application note describes a step-by-step procedure for the analysis of the EC20 Standard Test solutions by capillary electrophoresis with capacitively-coupled contactless conductivity detection (CE-C4D). The PowerChrom software from eDAQ is used to record and analyse the data.
Equipment Required
- C4D hardware unit, either:
- ER225 C4D Data System including PowerChrom software or
- ER815 C4D Detector with third-party data acquisition system
- ET120 C4D Headstage.
- EC020 Standard Test Solutions for C4D:
- BGE = 0.5M acetic acid
- Sample = 1mM LiCl, KNO3 and Na2SO4 in deionised water
- Computer with the latest PowerChrom software.
- Capillary electrophoresis instrument.
- Instruction manual to the CE instrument.
- Instruction manual to the C4D hardware and software.
- Application note found here showing how to connect the C4D to your CE instrument.
Conditions
The results in this application note were obtained using the following conditions:
- Separation voltage
- +30 kV for cations
- –30 kV for anions
- Capillary:
- Fused-silica from Polymicro Technologies
- Outer diameter = 360 μm
- Internal diameter = 25 μm
- Length = 65 cm
- Length to detector = 50 cm
- Injection: hydrodynamic 3 seconds at 50 mbar
- C4D settings
- Frequency = 1100 kHz
- Amplitude = 100 %
- Headstage gain ON
The 1mM LiCl, KNO3, Na2SO4 sample was diluted to 200 μM, 100 μM, 50 μM and 25 μM with the 0.5M acetic acid BGE.
Procedure
- Ensure you have installed the latest version of PowerChrom software from Software Downloads
- Connect the computer to the C4D hardware, following the instructions in the manual (website registration required).
- Connect the C4D headstage to your instrument, following the instructions in the relevant Application Note
- Turn on the C4D hardware.
- Open the PowerChrom software.
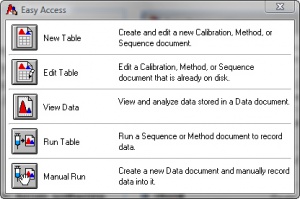
- In the Easy Access window, shown in Figure 1., click Manual Run.
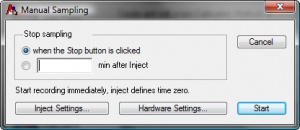
- In the Manual Sampling window, shown in Figure 2., click Hardware Settings.
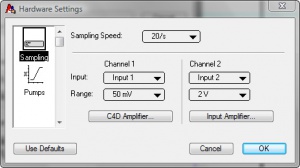
- Set the following values in the Hardware Settings window, as shown in Figure 3.:
- Sampling speed = 20/s
- Channel 1: Input = Input 1, Range = 50 mV
- Channel 2: Input = Input 2, Range = 2 V
- Under Channel 1, click C4D Amplifier.
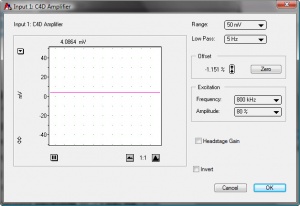
- Set the following values, as shown in Figure 4.:
- Range = 50 mV
- Low Pass= 5Hz
- Set the required values for Excitation Frequency and Amplitude, and set the Headstage Gain on or off. The optimum settings can be determined using C4D Profiler V2 Software. This is described in a separate application note.
- Inject your background electrolyte (BGE) into the capillary. This can done using the instrument’s controls. Alternatively, you can connect the headstage to the capillary outside the instrument, and manually inject the BGE into the capillary using a syringe connected to the capillary.
- Click Zero in the Offset box.
- Click OK to exit the C4D Amplifier window, and OK again to exit the Hardware Settings window.
- Click Start and enter a name for the file. Click Save.
- Click Inject, in the Manual Sampling box (shown in Figure 5.), when the sample is injected into the capillary.
- Click Stop, in the Manual Sampling box, when you have collected all of your peaks.
- Repeat steps 15, 16 and 17 for each blank, calibration standard and sample you wish to analyse.
- Analyse the data, by integrating the peaks and drawing a calibration graph, as shown in the PowerChrom software manuals and the screencast training videos
Results
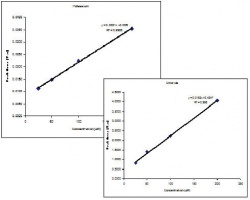
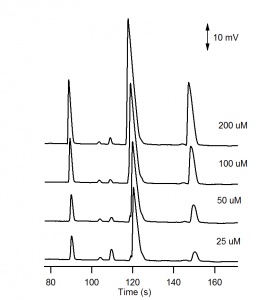
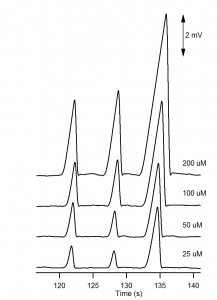
The electropherograms for the cations and anions are shown in Figure 6. and Figure 7, respectively. The calibration curves for potassium and chloride, shown in Figure 8., show good linearity.
For the analysis of the cations, three negative peaks are recorded. The peaks are negative because the three cations Li+, Na+ and K+ are less conductive than the H+ cation they are displacing in the background electrolyte. The electropherogram can be recorded with positive peaks (as in Figure 6) by selecting Invert in the C4D Amplifier window.
Notes
It is generally recommend to use a capillary with a small inner diameter such as 25 µm. Capillaries with larger inner diameters can lead to greater Joule heating and unstable baselines.
Dissolving in water leads to a difference in conductivity during loading, between the sample and the BGE in capillary. This produces an electrokinetic bias, where faster migrating compounds are introduced into the capillary in a greater quantity than slower migrating compounds.
If the volume of BGE in the EC20 Standard Test Solutions is not enough to rinse the capillary and perform the experiment, more 0.5M acetic acid can easily be made up by the user.
