Exporting Chart Data
This Application Note describes how to export Chart data and graphics into other file formats.
Contents
Introduction
Chart is a powerful analysis tool, but there may be times when it is desirable to access Chart data from other software applications. Here we describe several methods for placing Chart data and graphics into other programs.
Selecting and viewing data in Chart
When exporting data from Chart, you have the option of exporting a subset of your data or the entire data file. Which option you choose depends on the type and amount of data you wish to export. Select data by clicking and dragging the mouse over the data of interest in the Chart view window.
If you wish to select data in multiple channels, you can do so in one of two ways:
- Select a range of data in one channel, and then while holding down the Shift key on your keyboard, select data in another channel. The first selection will be preserved, and the selection in the second channel will be constrained to the same time interval as the initial selection.
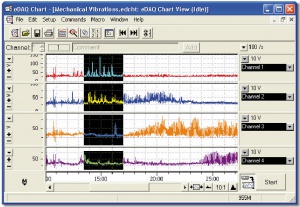
- Select data in all of the active Chart channels by clicking the mouse in the time axis area of the Chart view window, and dragging a selection (Figure 1).
After you select a range of data, you can use the Zoom view to expand the view of the selection. Click the Zoom view toolbar icon, and a new window will open showing only the data that you have selected. You can rescale the Y-axis in the Zoom view in exactly the same manner as you would in the Chart view. If you make a selection in the Zoom view, the window will be re-drawn to expand the view to that new selection. Use the Marker and Waveform Cursor in the Zoom view the same way you use them in the Chart view window.
Exporting graphics
To place a graphic of your data selection into another program:
- Make a selection in one or more channels and open the Zoom window by clicking the Zoom view icon in the Chart toolbar.
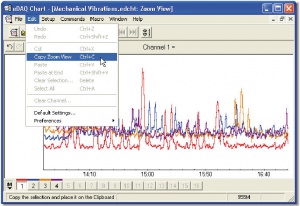
- With the Zoom view open, choose Edit → Copy Zoom View (Figure 2).
After the “Copy Zoom” command has executed, the Zoom window will be copied to your computer’s clipboard as a graphic file. The graphic can then be accessed from another application by using the “Paste” command in that application. Applications that can accept Chart Zoom graphics include Microsoft® Word™, Excel™, and PowerPoint™, and Adobe® Photoshop™.
Exporting numerical data
To use another application to analyze or plot data recorded in Chart, you need to extract numerical values from your Chart data file. Export numerical data from Chart when you want to:
- Use a statistical analysis program
- Use a specialized graphing program
- Use a spreadsheet with Chart data
- Save Data Pad data for analysis.
Copy/Paste
There are several methods available to export numerical data from Chart into other applications. The first, and simplest method, is to use the “Copy” command from the Edit menu after selecting a range of data, and then “Paste” the clipboard data into another application. When you choose the “Copy” command, the numerical values from the selected channel(s) are placed into the clipboard. Use this command if you want to paste Chart data into a spreadsheet such as Excel™.
- Make a selection of data in the Chart view window.
- Choose “Edit → Copy Chart Data”.
- Choose the “Edit → Paste” command from you application of choice.
- The numerical values are pasted into your application.
Data can also be copied from Chart’s other windows such as the Data Pad window.
Some applications, such as Excel, also have a “Paste Special” menu item, where copied Chart data can be pasted as a graphical representation or unicode text.
Automatically exporting Chart data into Excel
On the Windows platform, both Chart and Excel support Dynamic Data Exchange (DDE). With a bit of work in advance, it is possible to set up an Excel spreadsheet that automatically pulls data from Chart’s Data Pad, then does analysis and reporting on the collected data.
This feature is particularly useful when preparing reports from routine experiments.
To set up an Excel spreadsheet to link to Chart’s Data Pad:
- Open Excel
- Open Chart and set up the recording parameters as normal.
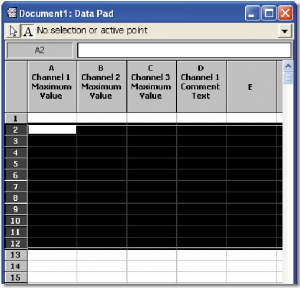
- Go to the Data Pad and set up the columns to calculate the statistics that you are interested in, as shown in Figure 3.
- Determine how many rows from the Data Pad you want to link to the spreadsheet. Click on the Insert Text icon and select the cells you want to link.
- Select Copy from the “Edit” menu, or press “Ctrl+C”.
- Click on the Excel window and put the cursor where you want the top-left of the transferred Data Pad information to go.
- In Excel, go to the “Edit” menu and choose “Paste Special”.
- In the dialog box that appears, choose “Paste Link”, then “Unicode Text”.
- You should now have a blank area that is a live copy of the data in the Data Pad. You might want to set the cell style for this area so that it has a border around it, so that its position is obvious. You can put formulae into Excel that works on the data in these cells.
- Now any data that appears in the selected region of the chart Data Pad, also appears in the excel spreadsheet.
Chart data is only transferred when both files are open. Changing a files name is possible when both files are open, however the link will be broken if the file name is changed when the other file is closed.
You can also paste a link to selected Chart data as a picture, which updates in Excel when the appearance changes in Chart.
Saving Chart data into other formats: Save As... and Save Selection
Another method of exporting Chart numerical data is to use the “Save As...” or “Save Selection” commands from Chart’s File menu. The “Save As...” command allows you to save the entire Chart data file into a different format, such as text. The “Save Selection” command allows you to save only the active selection in the Chart view in an alternate format.
Save As...
The “Save As...” command allows you to save the entire Chart data file in a different format. In addition, you can use the “Save As...” command to save the contents of the Data Pad.
- From the Chart view, choose File → Save As...
- A dialog box will open.
- Choose the type of file you would like to save, e.g., text (.txt), or Data Pad data as Excel (.xls) from the pull-down menu (Figure 3).
- Enter a filename for the exported data file.
- Click the “Save” button.
Save Selection
The Save Selection command works similarly to the “Save As...” command, but it will only export data in the active selection. Some special formats, such as QuickTime movies, are only available via the “Save Selection” command.
- Select the data of interest from the Chart view window.
- Choose File → Save Selection
- In the dialog box that appears, choose a file format from the pull-down menu.
- Enter a filename for the exported data file and click the “Save” button.
Special file formats
Chart is capable of exporting data into formats other than text. These formats include IGOR, MATLAB, QuickTime, and WAV audio formats. In order to export Chart data into these formats, you will need to install the appropriate Chart extension in your Chart Extensions folder. Chart extensions are free software add-ons that can be downloaded from the eDAQ website http://www.eDAQ.com/chart_extns_list.html.
- Download the extension to your computer and run the installer.
- Make sure the files are installed in your Chart Extensions folder on your computer.
- You will need to quit and restart Chart in order for the changes to take effect.
Example: Saving Chart data as a QuickTime™ movie
Chart data can be exported to an animated QuickTime™ movie when the “Export QuickTime” extension is installed.
- Select a range of data in the Chart view window.
- Choose File → Save Selection.
- In the dialog box that appears, select “QuickTime movie” from the pull-down menu.
- Click the “Options” button to choose output parameters for the QuickTime movie.
- Type a filename and click the “Save” button.
- Your selection will be saved as a viewable movie file that can be used in presentations (Figure 5).
Note: QuickTime movies require the free QuickTime viewer that can be downloaded from: http://www.apple.com/quicktime.


