SDx Protocol 1
This protocol is suitable for the measurement of tethered membrane conductivity with most ionophores, and other low molecular weight (2000 Da or less) ion channels, using a tethaPod™ system. Suitable ionophores for teaching experiments are listed in the Application Note: Ionophores in Society.
Make sure you are familiar with the concept of tethered membranes and use of the tethaPod software.
The buffer solution used in this protocol is PBS (phosphate buffered saline) solution. However equivalent protocols using different buffer solutions can also be used, eg 0.1 M KCl, Ringer's solution, normal saline, various Good's buffers, TBS, etc. Many of the ionophores mentioned below contain aliphatic carboxylic acid groups which have pKa's about 4.5 − 5. These are fully ionized at pH 6.5 or greater, and use of a suitable pH buffered solution gives greater water solubility.
Ionophores that are specific for dications (Mg2+, Ca2+ etc) require buffer solutions that contain significant concentrations of these ions.
Membrane formation
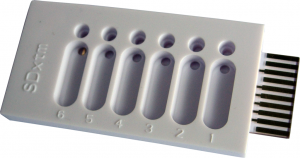
Assemble the tethaPlate as per its instructions. Now construct the membrane:
- To each input well add 10 µL of SDx-S1 Phospholipid mix, and incubate for 2 minutes to allow the phospholipid bilayer membrane to form.
- Add 200 µL PBS per well
- Successively rinse three times by the addition of 200 µL PBS.
- Remove the excess PBS from the waste well.
In cases where ion channel formation requires the presence of ergosterol or cholesterol (eg when studying Amphotericin B or Nystatin) it is necessary to add these substances the SDx-S1 Phospholipid Mix prior to membrane formation.
Solution Preparation
Ionophores are usually supplied in milligram quantities in vials or small bottles. A stock solution is usually prepared by rinsing the contents from the manufacturer's container into a larger vessel and making up a known volume of solution. Most manufacturers supply an amount of ionophore in a slightly greater quantity (by 1 − 10%) than indicated on the container's label. If exact concentrations are required, weigh the manufacturer's container before and after the contents are rinsed out, and use the determined mass in your calculations.
Make a 1 mM stock solution of the ionophore in methanol. Long term storage of this stock solution at −20°C (i.e. in a freezer) is recommended. Overnight storage, or even for several days, can be done at 2 − 4°C (ie in a refrigerator). Allow the stock solution to return to room temperature before using.
Now prepare a 10 µM (10000 nM) solution in PBS buffer by doing a 1:100 dilution of an aliquot of the stock solution. Most 'lipophillic' ionophores are either sufficiently water soluble so as to be able to achieve a 10 µM concentration, or will form a supersaturated solution long enough for you to prepare the more dilute solutions. Using the method of serial dilution to prepare solutions of 1, 10, 100, and 1000 nM in PBS buffer.
Note that the 10 µM solution will still contain only 1% methanol, which means that the solution is mainly water. Higher methanol concentrations can disrupt the membrane, or cause incomplete partitioning of the ionophore into the lipophilic membrane. If you need to use more concentrated ionophore solutions then you will need to make a more concentrated stock solution (eg 10 or even 100 mM, but beware that the ionophore might not be soluble at this level) and dilute this down to the desired levels.
Ionophore Addition
Ensure all solutions are thermally equilibrated at room temperature before starting.
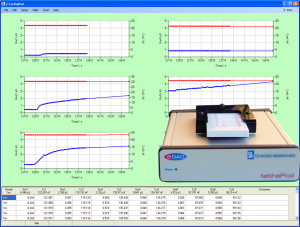
Start recording with the tethaPlate fitted to the tethaPod unit, proceed for several minutes until stable baseline signals are obtained for each of the sample wells. While still recording:
- Withdraw 200 µL of the PBS buffer from the tethaPlate waste well.
- Note the time and replace with 200 µL test solution at lowest ionophore concentration.
- Record the membrane conductivity for at least 5 minutes, or until the signal plateaus.
- Withdraw 200 µL of the old test solution from the tethaPlate waste well.
- Note the time and replace with 200 µL test solution at the next higher ionophore concentration.
- Record the membrane conductivity for at least 5 minutes, or until the signal plateaus.
- Repeat steps 4 − 6, until the highest ionophore concentration is reached (or until the conductivity signal goes off scale, or the membrane ruptures)
- Withdraw 200 µL of the old test solution from the tethaPlate waste well.
- Replace with 200 µL of the PBS buffer.
- Repeat steps 8 − 9 every minute, three times, and observe whether there is a decease in conductivity, indicating that the ionophore can be 'washed out'.
Presentation of Results
Derive conductivity ratios by dividing the observed conductivities by the baseline conductivity value, i.e. in the absence of ionophore.
Prepare a graph of log of conductivity ratio versus ionophore concentration, or log of concentration, as appropriate.
It is usual to find that there is a sudden rise in conductivity over a single decade of concentration increase. If you want better resolution on your graph then repeat the experiment using a series of test solutions prepared over this smaller concentration range.

