Difference between revisions of "Anions by MCE-C4D"
(→Conditions) |
|||
| Line 8: | Line 8: | ||
The three inorganic anions Cl–, NO3– and HSO4– were separated using microchip electrophoresis (MCE). These anions were then detected using the eDAQ C4D system. | The three inorganic anions Cl–, NO3– and HSO4– were separated using microchip electrophoresis (MCE). These anions were then detected using the eDAQ C4D system. | ||
| − | == Equipment Required == | + | == Equipment and Reagents Required == |
* [Http://www.edaq.com/ER255 ER255] or [Http://www.edaq.com/ER455 ER455] Microchip Electrophoresis bundles, including: | * [Http://www.edaq.com/ER255 ER255] or [Http://www.edaq.com/ER455 ER455] Microchip Electrophoresis bundles, including: | ||
** [Http://www.edaq.com/ER225 ER225 C4D Data System] | ** [Http://www.edaq.com/ER225 ER225 C4D Data System] | ||
| Line 15: | Line 15: | ||
** [http://www.edaq.com/ET145-4 ET145-4 CE Microchip (45 mm) kit] | ** [http://www.edaq.com/ET145-4 ET145-4 CE Microchip (45 mm) kit] | ||
** [http://www.edaq.com/ES280 PowerChrom] and [http://www.edaq.com/locked/software/sequencer.php Sequencer] softwares | ** [http://www.edaq.com/ES280 PowerChrom] and [http://www.edaq.com/locked/software/sequencer.php Sequencer] softwares | ||
| − | |||
| − | |||
* Background Electrolyte (BGE) = 70 mM TRIS/CHES with 1ppm HDMB, where TRIS is Tris(hydroxymethyl)aminomethane, CHES is 2-(Cyclohexylamino)ethanesulfonic acid, and HDMB is hexadimethrine bromide | * Background Electrolyte (BGE) = 70 mM TRIS/CHES with 1ppm HDMB, where TRIS is Tris(hydroxymethyl)aminomethane, CHES is 2-(Cyclohexylamino)ethanesulfonic acid, and HDMB is hexadimethrine bromide | ||
* Samples = 100 μM and 10 μM Cl–, NO3– and HSO4– in deionised water. | * Samples = 100 μM and 10 μM Cl–, NO3– and HSO4– in deionised water. | ||
| − | == Data and Limit of Detection == | + | == Data Analysis and Limit of Detection == |
Figure 1 shows the electropherogram of the 100 μM Cl–, NO3– and HSO4– solution. In order to measure the limit of detection of the anions, a 10 μM solution of the same analytes was analyzed. The electropherogram is shown in Figure 2. | Figure 1 shows the electropherogram of the 100 μM Cl–, NO3– and HSO4– solution. In order to measure the limit of detection of the anions, a 10 μM solution of the same analytes was analyzed. The electropherogram is shown in Figure 2. | ||
Using the definition of limit of detection as equal to three times the standard deviation of signal (during four seconds before the first peak), the limit of detection is 3.7 μM for Cl– and NO3–, and 1.3 μM for HSO4–. | Using the definition of limit of detection as equal to three times the standard deviation of signal (during four seconds before the first peak), the limit of detection is 3.7 μM for Cl– and NO3–, and 1.3 μM for HSO4–. | ||
Revision as of 22:24, 10 July 2013
The eDAQ C4D system was used to detect three inorganic anions, separated by microchip electrophoresis, by using contactless conductivity detection.
Introduction
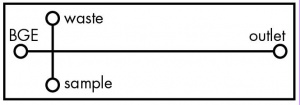
The three inorganic anions Cl–, NO3– and HSO4– were separated using microchip electrophoresis (MCE). These anions were then detected using the eDAQ C4D system.
Equipment and Reagents Required
- ER255 or ER455 Microchip Electrophoresis bundles, including:
- ER225 C4D Data System
- ET225 Micronit Platform
- ER230 High Voltage Sequencer (one or two units)
- ET145-4 CE Microchip (45 mm) kit
- PowerChrom and Sequencer softwares
- Background Electrolyte (BGE) = 70 mM TRIS/CHES with 1ppm HDMB, where TRIS is Tris(hydroxymethyl)aminomethane, CHES is 2-(Cyclohexylamino)ethanesulfonic acid, and HDMB is hexadimethrine bromide
- Samples = 100 μM and 10 μM Cl–, NO3– and HSO4– in deionised water.
Data Analysis and Limit of Detection
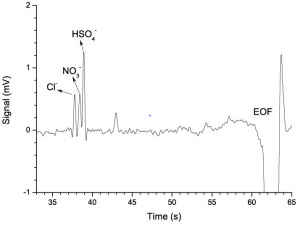
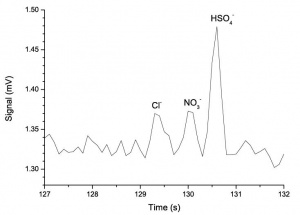
Figure 1 shows the electropherogram of the 100 μM Cl–, NO3– and HSO4– solution. In order to measure the limit of detection of the anions, a 10 μM solution of the same analytes was analyzed. The electropherogram is shown in Figure 2.
Using the definition of limit of detection as equal to three times the standard deviation of signal (during four seconds before the first peak), the limit of detection is 3.7 μM for Cl– and NO3–, and 1.3 μM for HSO4–.


