Difference between revisions of "C4Dキャピラリー電気泳動による飲料水のカチオンおよびアニオンの同時分析"
(→Working Conditions) |
(→必要な装置) |
||
| Line 11: | Line 11: | ||
== '''必要な装置''' == | == '''必要な装置''' == | ||
| − | * C4D 測定装置、 | + | * C4D 測定装置、 下記のいずれか: |
** [http://www.edaq.com/ER225 ER225 C4D データシステム] [http://www.edaq.com/ES280 PowerChrom ソフトウェア] または | ** [http://www.edaq.com/ER225 ER225 C4D データシステム] [http://www.edaq.com/ES280 PowerChrom ソフトウェア] または | ||
** [http://www.edaq.com/ER815 ER815 C4D 検出器] 及び市販のデータ収録装置 | ** [http://www.edaq.com/ER815 ER815 C4D 検出器] 及び市販のデータ収録装置 | ||
Revision as of 14:18, 27 May 2014
C4D 検出器を使ったキャピラリー電気泳動法による飲料水に含まれる標準的な10種類の無機イオン(アンモニア、カリウム、ナトリウム、カルシウム、マグネシウム、リチウム、塩素、硝酸塩、硫酸塩、及び硝酸塩)を同時モニターし定量測定しました。[1]
Contents
はじめに
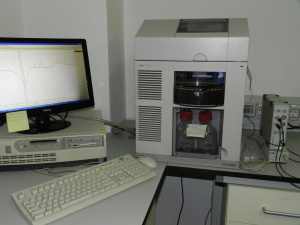
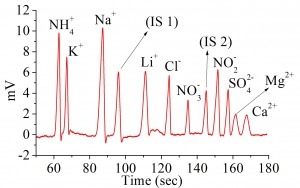
eDAQ 社の C4D を Agilent G1600 キャピラリー電気泳動システムと組み合わせて行ったものです。測定のデザインは (DoE)、最適な条件 (最短の分析時間内に最大の感度と選択性を示す)が得られるように広範かつ迅速なアプローチを実施し構築したもので、結果として全イオンの分離測定時間は3分程度に収まりました。
最適な分析方法は、検出及び定量測定の特異性、直線性、精度、限界の条件を基に検証されたものです。さらに、この方法は51箇所の飲料水(国内の源泉)に含有する無機イオンの評価にも効果的に適用され、その多変量データ解析法を用いて飲料水の組成とその地理的起源との相関関係を解明しました。
測定のオリジナル研究者:Ioan Ovidiu Neaga, Bogdan Cezar Iacob and Ede Bodoki at the Iuliu Hatieganu University of Medicine and Pharmacy, Romania
必要な装置
- C4D 測定装置、 下記のいずれか:
- ER225 C4D データシステム PowerChrom ソフトウェア または
- ER815 C4D 検出器 及び市販のデータ収録装置
- ET120 C4D ヘッドステージ
- Agilent G1600 キャピラリー電気泳動システム
測定条件
- 既知サンプル: 炭酸アンモニウム 15ppm、硝酸カリウム 15ppm、塩化カルシウム 15 ppm、塩化マグネシウム 10ppm、硫酸リチウム 10ppm、硝酸ナトリウム 15ppm を含む水溶液
- バッファー: ピロメリット酸 15mM、クエン酸 10mM、2mM の18-crown-6 ether をヒスチジンで pHを 3.70 に調整
- CE 装置
- 分離電圧 +30kV
- キャピラリー: PVA coated fused silica capillary
- Total length 60 cm, effective length 18 cm
- Outer diameter 360 μm, internal diameter 50 μm
- Sample injection: hydrodynamic, dual opposite end injection; First the sample was injected at the inlet applying a pressure of 500 mbar, followed by the second injection at the outlet, applying a negative pressure of 50 mbar for 5 seconds at the inlet
- C4D settings: frequency 1000 kHz; amplitude 100%; headstage gain: ON
- Data recording: low-pass filter: 5 Hz; range: 50 mV; sampling rate: 1000 data points per second with the aid of Chart v.5.5.8 software
Results
The electropherogram is shown in Figure 2. The limits of detection and limit of quantifications are shown in the table below.
| Ion | NH4+ | K+ | Na+ | Li+ | Cl- | NO3- | NO2- | SO42- | Mg2+ | Ca2+ |
|---|---|---|---|---|---|---|---|---|---|---|
| LODc (mg/L) | 1.54 | 0.45 | 0.075 | 0.094 | 2.51 | 0.92 | 0.076 | 0.901 | 0.44 | 2.33 |
| LOQc (mg/L) | 4.67 | 1.39 | 0.22 | 0.28 | 7.62 | 2.80 | 0.23 | 2.73 | 1.33 | 7.08 |
Reference
[1] The analysis of small ions with physiological implications using capillary electrophoresis with contactless conductivity detection; Ioan Ovidiu Neaga, Bogdan Cezar Iacob, Ede Bodoki; Journal of Liquid Chromatography & Related Technologies; manuscript accepted 11th July 2013

