Difference between revisions of "C4Dキャピラリー電気泳動の原理および使用方法"
(→手順) |
(→手順) |
||
| Line 48: | Line 48: | ||
| [[File:Hardware settings.jpg|300px|thumb|right|Figure 3. Hardware Settings ウィンドウ]] | | [[File:Hardware settings.jpg|300px|thumb|right|Figure 3. Hardware Settings ウィンドウ]] | ||
|} | |} | ||
| − | # まず、使用するPowerChrom | + | # まず、使用するPowerChrom ソフトウェアが最新のバージョンーであるか確認してください。最新バージョンは[http://www.edaq.com/software-downloads Software Downloads]からダウンロードできます。 |
# Connect the computer to the C4D hardware, following the instructions in the [http://www.edaq.com/locked/manuals.php manual (website registration required)]. | # Connect the computer to the C4D hardware, following the instructions in the [http://www.edaq.com/locked/manuals.php manual (website registration required)]. | ||
# Connect the C4D headstage to your instrument, following the instructions in the relevant [http://wiki.edaq.com/index.php/Application_Notes#C4D_Conductivity_Detector Application Note] | # Connect the C4D headstage to your instrument, following the instructions in the relevant [http://wiki.edaq.com/index.php/Application_Notes#C4D_Conductivity_Detector Application Note] | ||
Revision as of 11:37, 30 April 2014
キャピラリー電気泳動の検出器として C4D を使って PowerChromソフトウェアで分析する手順
はじめに
このアプリケーションノートでは、キャピラリー 電気泳動の分析に静電結合型の非接触電導度検出器(C4D) を使った手順を説明します。データは PowerChrom ソフトウ ェアで記録し解析します。
使用する装置
- C4D ハードウェア, 下記から選択:
- PowerChrom ソフトウェア を含むER225 C4D データシステムまたは、
- ER815 C4D 検出器 市販のデータ収録装置
- ET120 C4D ヘッドステージ.
- EC20 C4D 標準液セット:
- BGE = 0.5M 酢酸
- サンプル = 脱イオン水に 1mM LiCl, KNO3 及び Na2SO4
- コンピュータと最新バージョンの PowerChrom ソフトウェア.
- キャピラリー電気泳動装置(CE)
- CE 装置の操作マニュアル
- C4D 装置の取説書 (ウェブサイトで登録が必要です)
- アプリケーションノートには C4D と使用する CE 装置との接続方法が載っています。
測定条件
このアプリケーションノートは以下の条件で測定したものです:
- 分離電圧
- カチオン +30 kV
- アニオン –30 kV
- キャピラリー:
- Polymicro Technologies社のフューズトシリカ
- 外径 = 360 μm
- 内径 = 25 μm
- 長さ = 65 cm
- 検出器までの長さ = 50 cm
- インジェクション: ハイドロダイナミック 50 mbarで3秒
- C4D の設定
- 周波数 = 1100 kHz
- アンプリチュード = 100 %
- ヘッドステージゲイン ON
1mM LiCl, KNO3, Na2SO4 を0.5M 酢酸 BGE で 200 μM, 100 μM, 50 μM 、 25 μM に希釈してサンプル液とする。
手順
- まず、使用するPowerChrom ソフトウェアが最新のバージョンーであるか確認してください。最新バージョンはSoftware Downloadsからダウンロードできます。
- Connect the computer to the C4D hardware, following the instructions in the manual (website registration required).
- Connect the C4D headstage to your instrument, following the instructions in the relevant Application Note
- Turn on the C4D hardware.
- Open the PowerChrom software.
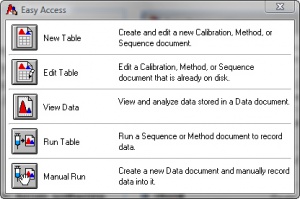
- In the Easy Access window, shown in Figure 1., click Manual Run.
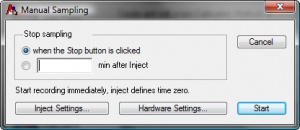
- In the Manual Sampling window, shown in Figure 2., click Hardware Settings.
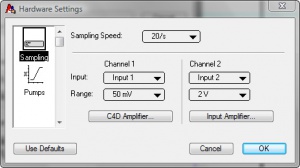
- Set the following values in the Hardware Settings window, as shown in Figure 3.:
- Sampling speed = 20/s
- Channel 1: Input = Input 1, Range = 50 mV
- Channel 2: Input = Input 2, Range = 2 V
- Under Channel 1, click C4D Amplifier.
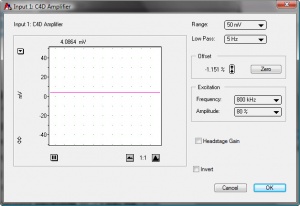
- Set the following values, as shown in Figure 4.:
- Range = 50 mV
- Low Pass= 5Hz
- Set the required values for Excitation Frequency and Amplitude, and set the Headstage Gain on or off. The optimum settings can be determined using C4D Profiler function, in the PowerChrom software. This is described in a separate application note.
- Inject your background electrolyte (BGE) into the capillary. This can done using the instrument’s controls. Alternatively, you can connect the headstage to the capillary outside the instrument, and manually inject the BGE into the capillary using a syringe connected to the capillary.
- Click Zero in the Offset box.
- Click OK to exit the C4D Amplifier window, and OK again to exit the Hardware Settings window.
- Click Start and enter a name for the file. Click Save.
- Click Inject, in the Manual Sampling box (shown in Figure 5.), when the sample is injected into the capillary.
- Click Stop, in the Manual Sampling box, when you have collected all of your peaks.
- Repeat steps 15, 16 and 17 for each blank, calibration standard and sample you wish to analyse.
- Analyse the data, by integrating the peaks and drawing a calibration graph, as shown in the PowerChrom software manual and screencast which you can download from www.edaq.com/screencasts.php
Results
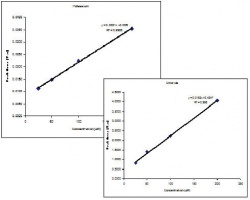
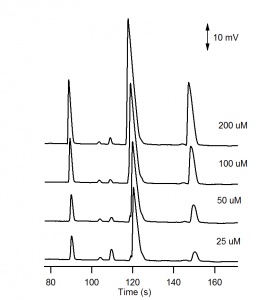
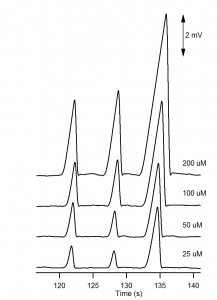
The electropherograms for the cations and anions are shown in Figure 6. and Figure 7, respectively. The calibration curves for potassium and chloride, shown in Figure 8., show good linearity.
For the analysis of the cations, three negative peaks are recorded. The peaks are negative because the three cations Li+, Na+ and K+ are less conductive than the H+ cation they are displacing in the background electrolyte. The electropherogram can be recorded with positive peaks (as in Figure 6) by selecting Invert in the C4D Amplifier window.
Notes
It is generally recommend to use a capillary with a small inner diameter such as 25 µm. Capillaries with larger inner diameters can lead to greater Joule heating and unstable baselines.
Dissolving in water leads to a difference in conductivity during loading, between the sample and the BGE in capillary. This produces an electrokinetic bias, where faster migrating compounds are introduced into the capillary in a greater quantity than slower migrating compounds.
If the volume of BGE in the EC20 Standard Test Solutions is not enough to rinse the capillary and perform the experiment, more 0.5M acetic acid can easily be made up by the user.
