Difference between revisions of "C4D Analysis of Acetylchorine Chloride on a Prince CE System"
From eDAQ Wiki
(Created page with "AChCl peaks at different concentrations Calibration curve ''The eDAQ C4D syste...") |
|||
| Line 1: | Line 1: | ||
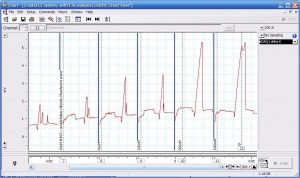
| − | [[File:Peaks of AChCl.jpg|300px|thumb|right|AChCl peaks at different concentrations]] | + | [[File:Peaks of AChCl.jpg|300px|thumb|right|Figure 1. AChCl peaks at different concentrations]] |
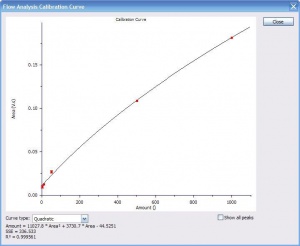
| − | [[File:Calib curve AChCl3.jpg|300px|thumb|right|Calibration curve]] | + | [[File:Calib curve AChCl3.jpg|300px|thumb|right|Figure 2. Calibration curve]] |
''The eDAQ C4D system was connected to the PrinCE-C 600 capillary electrophoresis instrument and acetylcholine chloride was analysed.'' | ''The eDAQ C4D system was connected to the PrinCE-C 600 capillary electrophoresis instrument and acetylcholine chloride was analysed.'' | ||
| Line 15: | Line 15: | ||
** CTAB is hexadecyltrimethylammonium bromide | ** CTAB is hexadecyltrimethylammonium bromide | ||
* Instrument: | * Instrument: | ||
| − | + | ** separation voltage = 30 kV | |
| − | + | ** recorded separation current = 11 – 12 µA | |
* Capillary: | * Capillary: | ||
| − | + | ** outer diameter = 360 µm | |
| − | + | ** internal diameter = 25 µm | |
| − | + | ** length = 56 cm | |
| − | + | ** length to detector = 42 cm | |
* Injection: pressure 300 mbar for 10 seconds | * Injection: pressure 300 mbar for 10 seconds | ||
| − | * C4D | + | * C4D |
| − | + | ** frequency = 500 kHz | |
| − | + | ** amplitude = 100 A | |
| + | ** headstage gain OFF | ||
* Data recording: | * Data recording: | ||
| − | + | ** lowpass Filter = 1 Hz | |
| − | + | ** range = 50 mV | |
| − | + | ** sampling rate = 100 data points per second | |
== Data Analysis == | == Data Analysis == | ||
Figure 1 shows the AChCl peaks at the different concentrations. | Figure 1 shows the AChCl peaks at the different concentrations. | ||
Figure 2 shows how the software can automatically produce a calibration curve by plotting the peak areas versus known concentrations of analyte. | Figure 2 shows how the software can automatically produce a calibration curve by plotting the peak areas versus known concentrations of analyte. | ||
Revision as of 16:47, 8 July 2013
The eDAQ C4D system was connected to the PrinCE-C 600 capillary electrophoresis instrument and acetylcholine chloride was analysed.
Introduction
The eDAQ C4D system was connected to the PrinCE-C 600 capillary electrophoresis (CE) instrument as described in the application note C4D004. Acetylcholine chloride (AChCl) was then analysed and a calibration curve was produced. The CE instrument was set to negative mode and the C4D system measured the Cl- anions.
Conditions
- Analyte: Acetylcholine chloride (AChCl) dissolved in water, analysed at the concentrations 10 mM, 50 mM, 100 mM, 500 mM and 1000 mM
- Buffer:
- MES/Arg/CTAB with pH 5.7, where
- MES is 2-(N-morpholino)ethanesulfonic acid,
- Arg is L(+)-Arginine,
- CTAB is hexadecyltrimethylammonium bromide
- Instrument:
- separation voltage = 30 kV
- recorded separation current = 11 – 12 µA
- Capillary:
- outer diameter = 360 µm
- internal diameter = 25 µm
- length = 56 cm
- length to detector = 42 cm
- Injection: pressure 300 mbar for 10 seconds
- C4D
- frequency = 500 kHz
- amplitude = 100 A
- headstage gain OFF
- Data recording:
- lowpass Filter = 1 Hz
- range = 50 mV
- sampling rate = 100 data points per second
Data Analysis
Figure 1 shows the AChCl peaks at the different concentrations. Figure 2 shows how the software can automatically produce a calibration curve by plotting the peak areas versus known concentrations of analyte.

