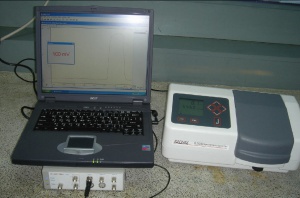
Jenway Spectrophotometer with the e-corder
The e-corder can be connected to the range of Jenway spectrophotometers. This enables the spectrophotometer to be used as a detector in flow injection analysis (FIA) experiments.
Contents
Introduction
Jenway (Staffordshire, UK) www.jenway.com manufactures a range of spectrophotometers with analog outputs. The analog output can be connected to the e-corder. The Chart software is then used to plot the absorbance against time. The spectrophotometer can be used as an absorbance detector.
Equipment Required
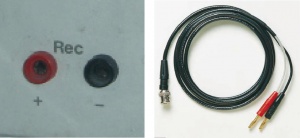
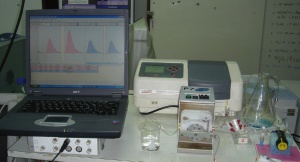
e-corder with Chart software Spectrophotometer with analog output BNC to banana plugs cable Optional for FIA: flow cell, pump and tubing
Spectrophotometer as a FIA Detector
If the cell in the spectrophotometer is replaced with a flow cell, and the wavelength is fixed, the e-corder will record the change in absorbance as analytes pass through the spectrophotometer.
Chart Extensions
The two Chart Extensions “Absorbance” and “FIA“ are available to assist with this application. They can be downloaded from www.edaq.com/chart_extns_list.html
“Absorbance” converts the spectrophotometer transmittance signal into a linear absorbance signal.
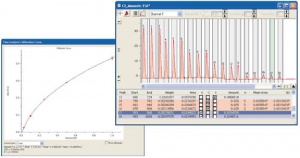
“FIA” enables the Chart software to detect and calibrate peaks from Flow Injection Analysis (FIA) and similar experiments. Calibration by peak area or peak height is possible and there are several calibration curve fitting functions available. The software generates peak reports, and the data can be exported to other applications for further analysis.


