Difference between revisions of "Procedure for Microchip Electrophoresis with C4D with the ET121"
| Line 10: | Line 10: | ||
{| | {| | ||
| − | | [[File: | + | | [[File:Effect of C4D frequency on peak shape, 1000 kHz.jpg|300px|thumb|right|Figure . 1000 kHz: three triplet peaks]] |
| − | | [[File: | + | | [[File:Effect of C4D frequency on peak shape, 700 kHz.jpg|300px|thumb|right|Figure . 700 kHz: negative peaks are more obvious]] |
| − | | [[File: | + | | [[File:Effect of C4D frequency on peak shape, 250 kHz.jpg|300px|thumb|right|Figure . 250 kHz: optimum frequency]] |
|} | |} | ||
Revision as of 19:11, 19 December 2016
Positioning of the High Voltage Electrodes
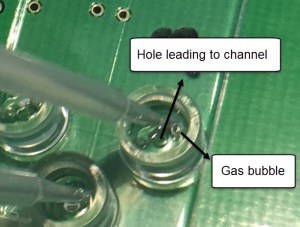
Applying a high voltage to a solution can cause the formation of gas bubbles at the electrodes. This can prevent the flow of electrical current. It can also result in an electric arc which produces high temperatures and can damage the chip. You should avoid positioning the high voltage electrodes inside the hole at the very bottom of reservoir, that leads to the chip's channel. The formation of a gas bubble inside this hold could prevent the flow of current.
Chip Preparation
Unlike glass microfluidic chips, plastic chips don’t normally require to be preconditioned before use. Researchers using plastic chips such as PMMA poly(methylmethacrylate) have reported they simply flushed the chip's channel with deionized water and then background electrolyte for a few minutes each. At the end of a working day, the microchips should be rinsed with deionized water in order to prevent the formation of salts which may clog the channels.
Selection of C4D Frequency and Peak Shape
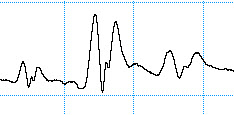
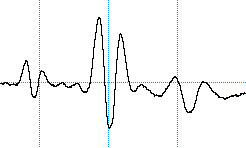
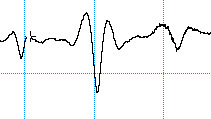
Selecting an unsuitable C4D frequency can greatly change the shape of the analyte peaks. The electropherograms show the same analysis recorded using different C4D frequencies. When measuring potassium, sodium and lithium in acetic acid, negative peaks are expected. The first run at a C4D frequency of 1000 kHz produced what looked like three triplet peaks. When the frequency was reduced to 700 kHz, the negative peaks became more obvious. The optimum frequency was found to be at 250 kHz.


