Rapid Determination Method for Total Number of Pathogenic Vibrio Volonies in Shrimp Aquaculture Water
1 Scope
This standard specifies the method for determining the total number of pathogenic Vibrio colonies in shrimp aquaculture water.
2 Normative references
This standard references certain provisions contained in the reference standard. For dated citation standards, subsequent changes or revisions will not apply. However, parties who agree to follow this standard are encouraged to consider using the latest version of the reference standard described below.
3 Principle of testing
During the growth process of pathogenic Vibrio, the microorganism metabolizes large molecules with weak electrical conductivity, such as amino acids, into small molecules and ions with better conductivity in the culture medium (i.e., thiosulfate-citrate-bile-sucrose agar liquid selective culture medium), causing changes in the conductivity of the liquid medium system. This change can be continuously monitored online in real-time using an electronic microbial growth analyser based on the capacitively-coupled non-contact conductance principle. The corresponding measurable time (Dt) exhibits an inverse relationship with the initial concentration (C0) of the cultivable bacteria, which can be established as a quantitative measurement curve. Therefore, the number and concentration of pathogenic Vibrio colonies in shrimp aquaculture water can be determined by automatically measuring Dt using the electronic microbial growth analyser.
4 Equipment and materials
In addition to the routine sterilization and culture equipment in the microbiology laboratory, the following equipment and materials are required:
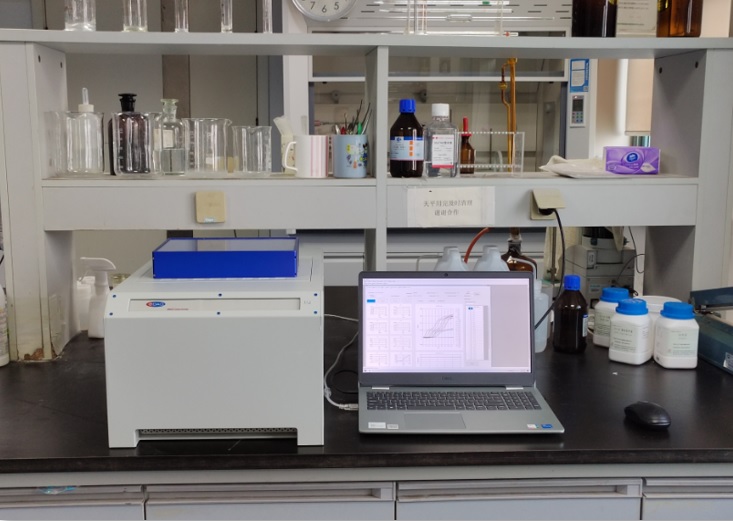
4.1 16/32 channels CellStatz microbial growth analyser
4.2 Sterile surgical scalpels and forceps, disposable glass test tubes (referred to as "test tubes" for short)
4.3 Sterile glass bottles with a capacity of 100 mL specifically designed for microbiological applications
4.4 Micropipettes and tips: 100 μL (1 μL graduation), 1 mL (0.01 mL graduation), 5 mL (0.1 mL graduation), 10 mL (0.1 mL graduation)
4.5 Analytical balance: sensitivity of 0.001 g
4.6 Thermostatic incubator: 36°C ± 1°C
4.7 Sterile conical flask: Capacity of 250 mL, 500 mL
4.8 Sterile culture dish: Diameter of 90 mm
4.9 Sterile centrifuge tubes: Capacity of 2 mL, capacity of 15 mL
4.10 Thermal insulation container
5 Medium and reagent
5.1 LB liquid medium: Details see A1
5.2 Plate counting AGAR medium: Details see A2
6 Test procedure
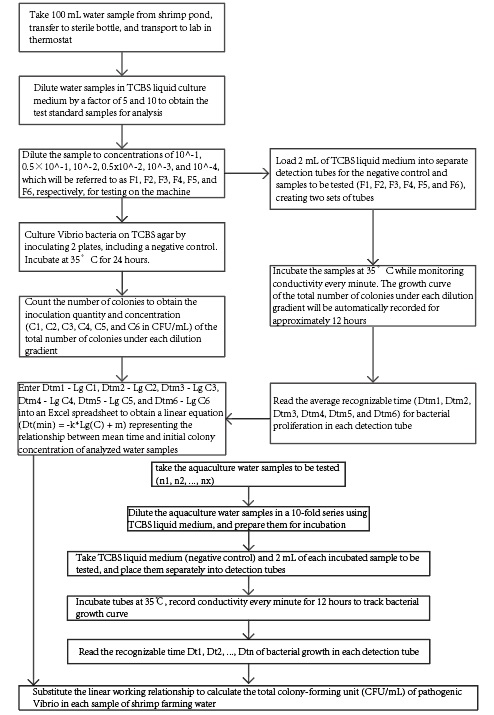
See the block diagram below:
7 Detailed test procedure
7.1 Develop the standard growth curves for the total number of colonies
7.1.1 A 100 mL water sample was aseptically collected at random from the shrimp culture pond and transferred into a sterile microbiological bottle. The sample was then immediately transported to the laboratory under controlled temperature conditions using an incubator.
7.1.2 Aseptic procedures were employed to aseptically transfer 2 mL of the mixed sample into a sterile 50 mL centrifuge tube. Subsequently, 18 mL of liquid thiosulfate-citrate-bile-sucrose (TCBS) culture medium was added to the centrifuge tube and mixed thoroughly to prepare a 10-fold diluted sample suspension denoted as F1.
7.1.3 The F1 sample suspension was diluted using liquid thiosulfate-citrate-bile-sucrose (TCBS) culture medium to prepare six different concentration gradients (10^-2, 10^-3, 10^-4, 10^-5, 10^-6), designated as F1, F2, F3, F4, F5, and F6. These samples were prepared as standard test samples for subsequent analysis.
7.1.4 3 mL of each standard test sample (F1-F6) were aseptically transferred using a 5 mL micropipette into three separate sterile culture plates, with 1 mL of TCBS liquid culture medium used as a negative control. Approximately 15-20 mL of TCBS agar, previously cooled to around 45℃ (maintained at 45℃±1℃ using a constant-temperature water bath), was poured into each plate. The plates were gently rotated to ensure uniform mixing of the agar and the test samples (F1-F6) and negative control (TCBS liquid culture medium). After the agar had solidified, 4 mL of liquid TCBS agar was added onto the surface of each plate, which was then gently swirled to distribute the agar evenly. The plates were incubated at 35℃±1℃ for 24 hours, and bacterial colonies that ranged from 30 to 300 colony-forming units (CFU) were selected and counted to determine the total number of Vibrio parahaemolyticus colonies. The average number of bacterial colonies was calculated, and the bacterial concentration (CFU/mL) of each standard test sample (F1-F6) was determined based on the dilution factor.
7.1.5 A micropipette was used to extract 6 mL of the standard samples F1, F2, F3, F4, F5, and F6 for each of the three parallel measurements. These samples were then evenly distributed into three test tubes. Additionally, 6 mL of sterile TCBS liquid culture medium was added into three test tubes as blank controls, denoted as R1, R2, and R3. The 21 test tubes were inserted into the detection channel of an electronic microbial growth analyser, and the instrument software was opened. The temperature was set to 35℃, and the recording period for the conductivity σ was set to 1 min. The instrument was then run to generate real-time conductivity changes Δσ1-Δσ18 and ΔσR1-ΔσR3, as well as the relationship curves Q1-Q18 and QR1-QR3 between the conductivity changes and the cultivation time t. The inflection points Dt1-Dt18 and DtR1-DtR3 on the curves corresponded to the recognizable times for bacterial proliferation in each test tube. The recognizable time mean values for the initial inoculation concentrations C1-C6 were obtained by averaging the inflection points for each group. The recognizable time mean value for the initial inoculation concentration of 0 was obtained by averaging the inflection points for the blank controls. The recognizable time mean values were then inputted into an Excel spreadsheet and used to obtain the linear working function relationship formula Dt (min) = -k Lg(C) + m and the correlation coefficient R2 between the recognizable time mean value and the initial pathogenic vibrio colony total concentration in the analysed shrimp culture water.
7.2 Examine samples
7.2.1 Sample preparation: The same method as described in section 7.1.1 was used to prepare the samples for analysis.
7.2.2 On-machine testing: Use a micropipette to individually extract 2 mL of each on-machine sample to be tested, n1, n2, …… nx, and transfer them into separate test tubes. Use 2 mL of sterile TCBS liquid medium as a blank control. Insert the test tubes into the detection channel of an electronic microbial growth analyzer in order. Open the instrument software, set the temperature to 35℃, and set the recording period of conductivity σ to 1 min. Then, run the test for 12 hours to obtain the values of Dt1, Dt2, …… Dtn and Dtr on each curve.
7.2.3 Data acquisition: Substitute Dt1, Dt2, …… Dtn into the working function relationship formula Dt (min) = -k Lg (C) + m to obtain the corresponding values of Lg (C). This value multiplied by 10 Lg(C) is the total number of pathogenic Vibrio colonies in the shrimp aquaculture water being tested, reported in CFU/mL.
7.2.4 Result reporting: When the total number of pathogenic Vibrio colonies in the tested sample is <100, it is reported using two significant figures. When it is ≥100, the third digit is rounded using "rounding off" and then replaced with zeros to represent the result. The result can also be expressed in exponential form using 10 as the base.
7.3 Test report
The experimental report should include the following essential details:
- Complete identification of the sample, including all necessary information. - Description of the sampling method used (if applicable). - All operational details and potential factors that may have affected the test results, which are not specified in this standard. - Presentation of the obtained results, along with an indication of the representation method used. - Final results, referencing the results obtained from any reproducibility checks.
8 Additional information:
- The systematic error of this method is ≤20%. - The linear range of this method is 10^1-10^5 CFU/mL. - Separate working functions should be established for clam samples from different locations. - The validity of the working function needs to be verified every six months using the plate counting method. - Personnel and laboratory comparisons have been completed.
Appendix A
A.1: TCBS (Thiosulfate Citrate Bile Sucrose) Liquid Medium
A.1.1 Composition
Peptone: 10.0 g
Yeast extract: 5.0 g
Sodium citrate: 10.0 g
Sodium thiosulfate: 10.0 g
Sodium chloride: 10.0 g
Bile salt: 5.0 g
Sodium taurocholate: 3.0 g
Ferric citrate: 1.0 g
Sucrose: 20.0 g
Bromothymol blue: 0.04 g
Thymol blue: 0.04 g
Distilled water: 1000.0 mL
A.1.2 Preparation
The components listed in A.1.1 were dissolved in distilled water and the pH was adjusted to 8.6±0.2. The solution was heated to boiling until all the components were completely dissolved. The mixture was then cooled and kept for further use.
A.2: TCBS (Thiosulfate Citrate Bile Sucrose) Agar Medium
A.2.1 Composition
Peptone 10.0 g
Yeast extract 5.0 g
Sodium citrate 10.0 g
Sodium thiosulfate 10.0 g
Sodium chloride 10.0 g
Bile powder 5.0 g
Sodium taurocholate 3.0 g
Ferric citrate 1.0 g
Sucrose 20.0 g
Bromothymol blue 0.04 g
Thymol blue 0.04 g
Agar 15.0 g
Distilled water 1,000.0 mL
A2.2 Method The components in A.2.1 are dissolved in distilled water, and the pH is adjusted to 8.6±0.2. The mixture is then heated and boiled until fully dissolved, and allowed to cool to about 50°C before use.
Experimental Data Support Experimental Procedure: Preparation of standard curve samples:
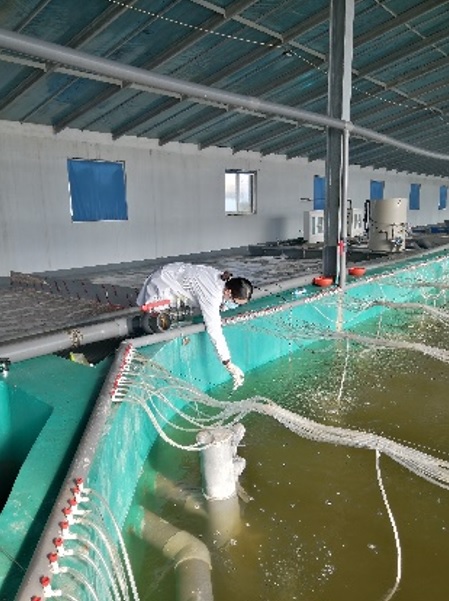
1 Sampling location: No. 10 workshop shrimp farming pond, Nan section of Binhai West Road, Haiyang City, Huanghai Aquatic Products Co., Ltd. 121°9′26.9028″E; 36°40′49.9152″N. Two parallel samples A1 and A2 were taken from the surface water and placed in sterile microbiological bottles. (Note: The above water samples to be tested are placed in a thermos box with ice packs.)
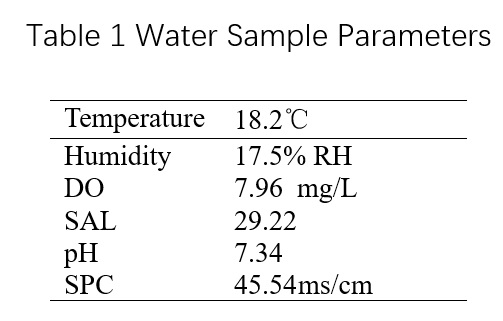
2 The water samples were brought back to the laboratory and left at room temperature. The YSI multi-parameter water quality detector was used to measure the following results:
3 Under aseptic conditions, 2 mL of the mixed sample to be tested was taken and placed in a sterile centrifuge tube of 50 mL. Then, 18 mL of TCBS liquid culture medium was added and mixed thoroughly to prepare a diluted 10-fold sample homogenate (F1).
4 The F1 sample homogenate was diluted with LB liquid culture medium to prepare 6 concentrations of standard test samples with dilutions of 0.5x10^-1, 10^-2, 0.5x10^-2, 10^-3, 10^-4. These dilutions were labelled as F1, F2, F3, F4, F5, and F6.
5 Using a 5 mL micropipette, 3 mL of each standard test sample (F1, F2, F3, F4, F5, and F6) were drawn and inoculated into 3 sterile culture dishes each. 1 mL of sterile TCBS was used as a blank control. About 15-20 mL of TCBS agar medium cooled to around 45℃ (which can be placed in a constant temperature water bath at 45℃±1℃ for insulation) was carefully poured into each culture dish. The culture dishes were gently rotated to mix the medium with the standard test samples (F1, F2, F3, F4, F5, and F6) and the liquid TCBS used as a blank control. After the agar solidified, 4 mL of unset TCBS agar was added to cover the surface of each plate using a micropipette. The plates were rotated and incubated at 35℃±1℃ for 24 hours. The plates with colony counts between 30-300 CFU were selected, and the number of colonies on each plate was counted to obtain the average number of colonies.
6 From the plate count results, the bacterial concentration of the sample can be obtained, which indicates the initial bacterial concentration of each sample in the standard curve. The detection time (Dt) of the sample with different bacterial concentrations that can reach a detectable change in the reaction can be obtained from the microbial growth curve. Based on the relationship between Dt and bacterial concentration, a standard curve can be constructed.
Prepare test samples:
1 A water sample was taken from the shrimp culture pool in Workshop 10 of Huanghai Aquatic Products Co., Ltd. Aseptically, 2 mL of the mixed sample was taken and placed in a 50 mL sterile centrifuge tube. 18 mL of TCBS liquid culture medium was added, mixed well, and prepared into a uniform solution of the test sample (Y1, Y2, Y3, Y4, Y5, Y6, Y7) with 10^-1 concentration.
2 Take 2 mL of each sample homogenate and transfer it to a test tube. Prepare two replicates for each sample. Place the test tubes, along with the standard curve samples, into a 32-channel microbiological growth sensor and incubate at 35°C for 12 hours. This will generate a microbial growth curve for the test samples.
3 The detection sample is subjected to plate counting as follows: the detection sample solution is serially diluted 10 times using TCBS, resulting in three dilutions: 10^-2, 10^-3, and 10^-4. Each dilution is inoculated onto 3 sterile culture dishes, with 1 mL per dish, and 1 mL of TCBS is added to a sterile culture dish as a blank control. Then, 15-20 mL of cooled (approximately 45℃) plate counting agar (which can be kept warm in a constant temperature water bath at 45℃±1℃) is carefully poured into each culture dish. The culture dishes are rotated gently to mix the agar with the sample solution, and allowed to solidify. Afterward, 3-4 mL of TCBS is added to cover the surface of each plate, and the plates are rotated and incubated at 35℃±1℃ for 24 hours. The plates with a bacterial count between 30 and 300 CFU are selected, and the number of bacterial colonies on each plate is counted. The total concentration of pathogenic vibrio bacteria in the detection sample is obtained by plate counting.
Data processing:
Plot the microbial growth curve based on the conductivity and cultivation time (T, in minutes) obtained from the microbial growth sensor. Obtain the quantitative working function Dt (min) = -k Lg(C) + m based on the relationship between the standard bacterial liquid concentration and detection time. Substitute the detection time Dt obtained when the 10^-1 test sample reaches detectable changes into the above function to obtain the corresponding Lg(C) value. The value of 10 Lg(C) is the total number of colonies in the 10^-1 test sample, which, when multiplied by 10, gives the total number of pathogenic Vibrio colonies in the test water sample (reported as CFU/mL).
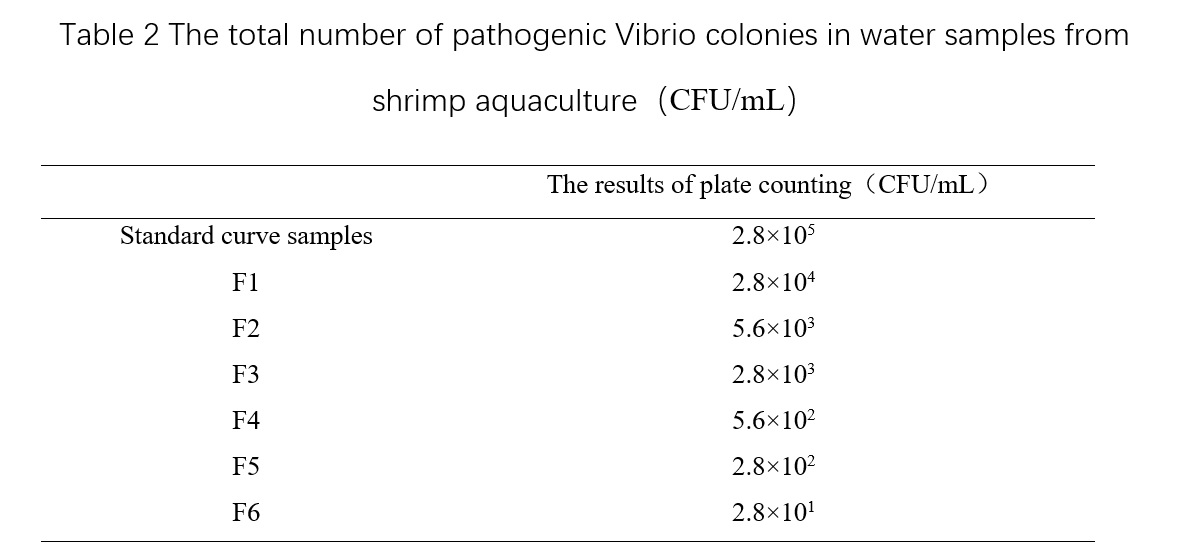
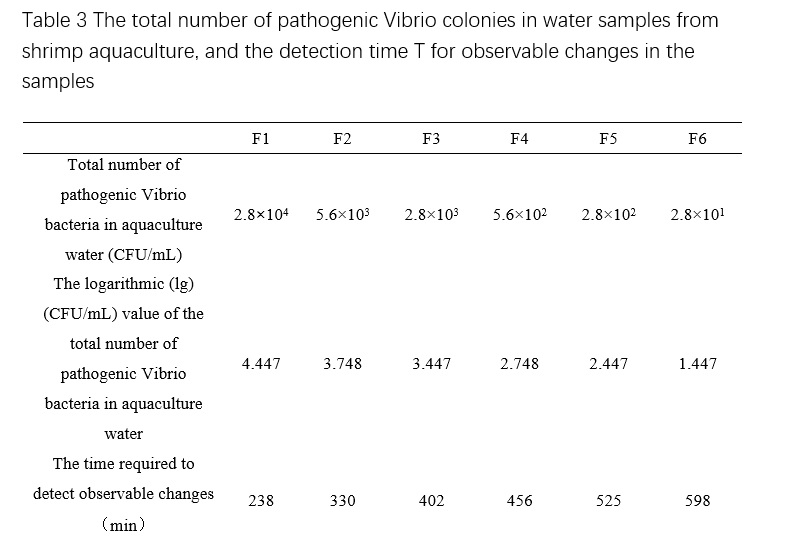
From Table 2, we can see that the plate counting results of the standard curve sample is 2.8×10^5 CFU/mL, which means that the total number of pathogenic Vibrio colonies in the standard curve diluted samples tested by the machine are 2.8×10^4, 5.6×10^3, 2.8×10^3, 5.6×10^2, 2.8×10^2, and 2.8×10^1 CFU/mL, respectively. Based on the conductivity and cultivation time (T, in minutes) obtained from the microbial growth sensor of the standard curve diluted samples, the microbial growth curve can be plotted (Figure 2), and the detection time when the total number of pathogenic Vibrio colonies of different concentrations reached detectable changes can be obtained (Table 3). The relationship between the total number of pathogenic Vibrio colonies and detection time in shrimp culture water can be obtained by plotting the curve based on Table 3 (Figure 3), which is Dt = -121.63 Lg(C) + 795.48, R² = 0.9736. Then, based on the microbial growth curve of the test sample, the detection time T1~T7 when the sample reached detectable changes can be obtained, and the total number of pathogenic Vibrio colonies in the test sample can be obtained by substituting the time into the above relationship.
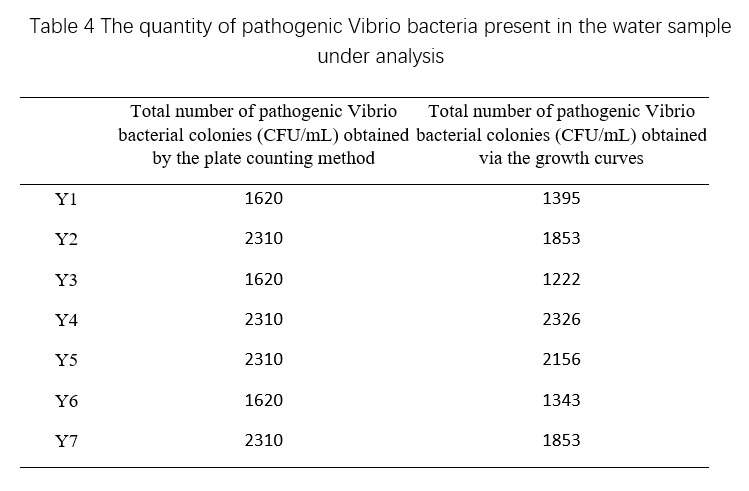
Table 4 demonstrates that the total number of pathogenic Vibrio bacterial colonies detected using microbial growth sensors in various shrimp aquaculture water samples is within the same order of magnitude as the results obtained through plate counting, indicating the method's ability to meet the detection requirements. Furthermore, this approach enables the acquisition of microbial growth curves for deeper research and provides a rapid and efficient means of determining the total number of pathogenic Vibrio bacterial colonies in shrimp aquaculture water samples.
