File list
This special page shows all uploaded files.
First page |
Previous page |
Next page |
Last page |


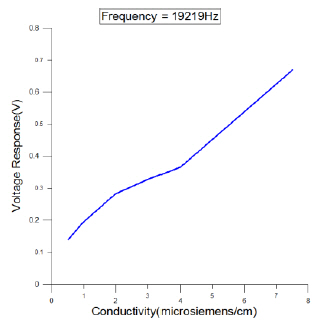
_Imidazole,_(anionic_IS_2)_ClO4-.jpg)


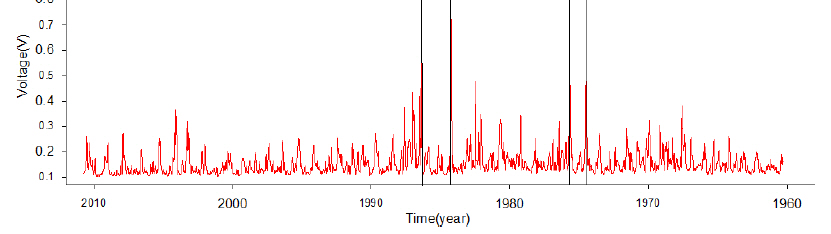
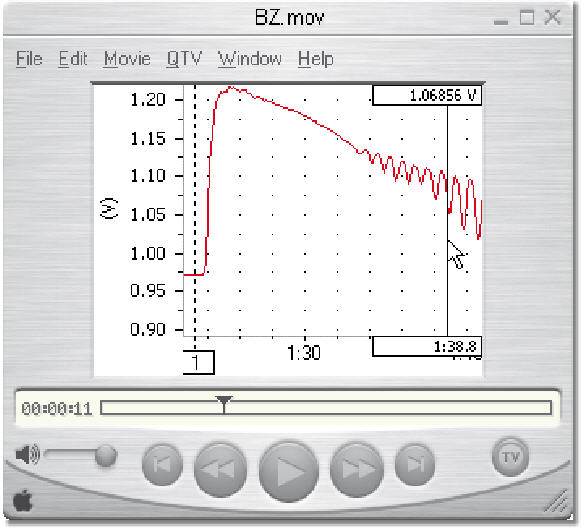
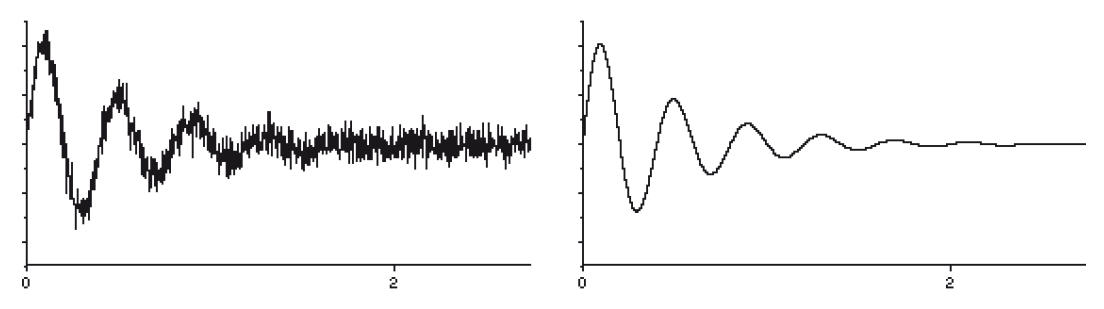
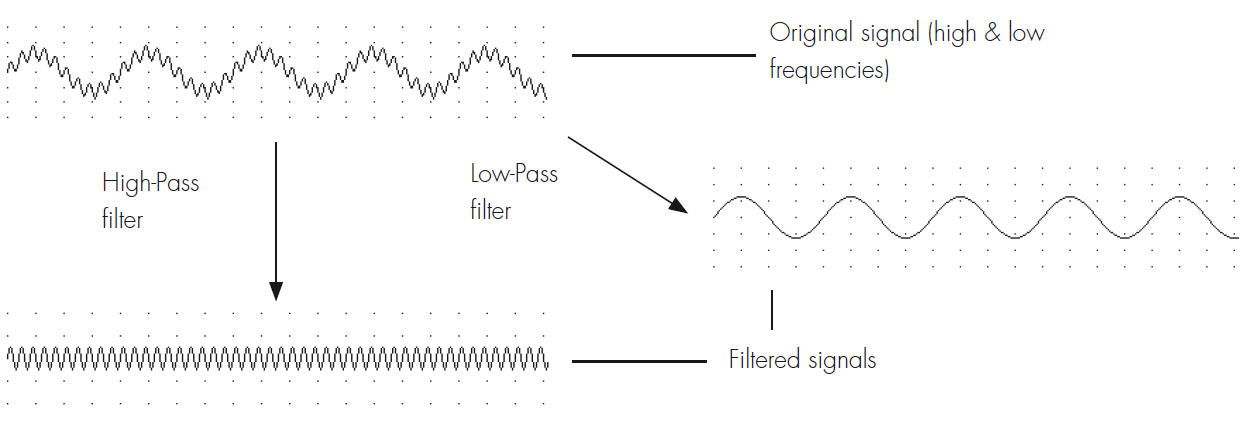
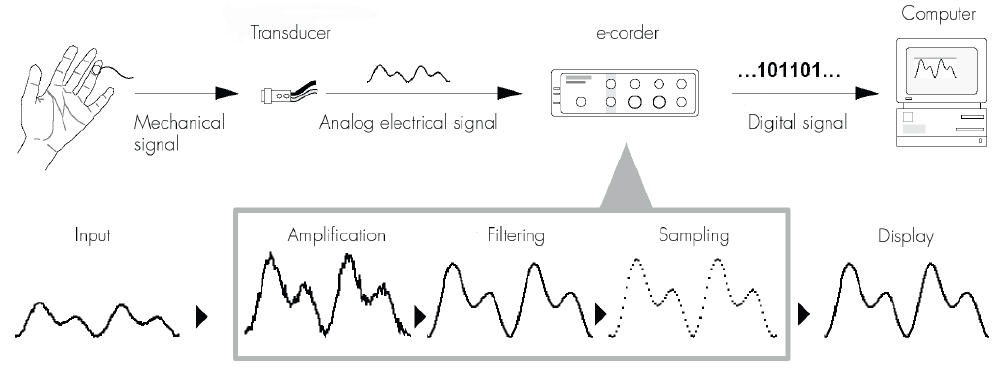
_can_mar_the_original_signal_(right),_unless_filtered_out.jpg)


First page |
Previous page |
Next page |
Last page |
This special page shows all uploaded files.
First page |
Previous page |
Next page |
Last page |
First page |
Previous page |
Next page |
Last page |