MIME search
This page enables the filtering of files for their MIME type.
Input: contenttype/subtype or contenttype/*, e.g. image/jpeg.
Showing below up to 100 results in range #51 to #150.
View (previous 100 | next 100) (20 | 50 | 100 | 250 | 500)
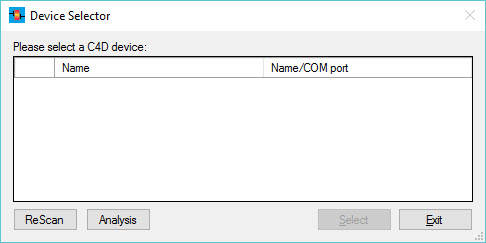
- (download) Device Selector, Please select a C4D device (C4D Profiler V2).jpg . . 486 × 243 . . 23 KB . . Oliver . . 16:15, 23 May 2017
- (download) Digital outputs.jpg . . 80 × 49 . . 2 KB . . Oliver . . 16:44, 10 June 2013
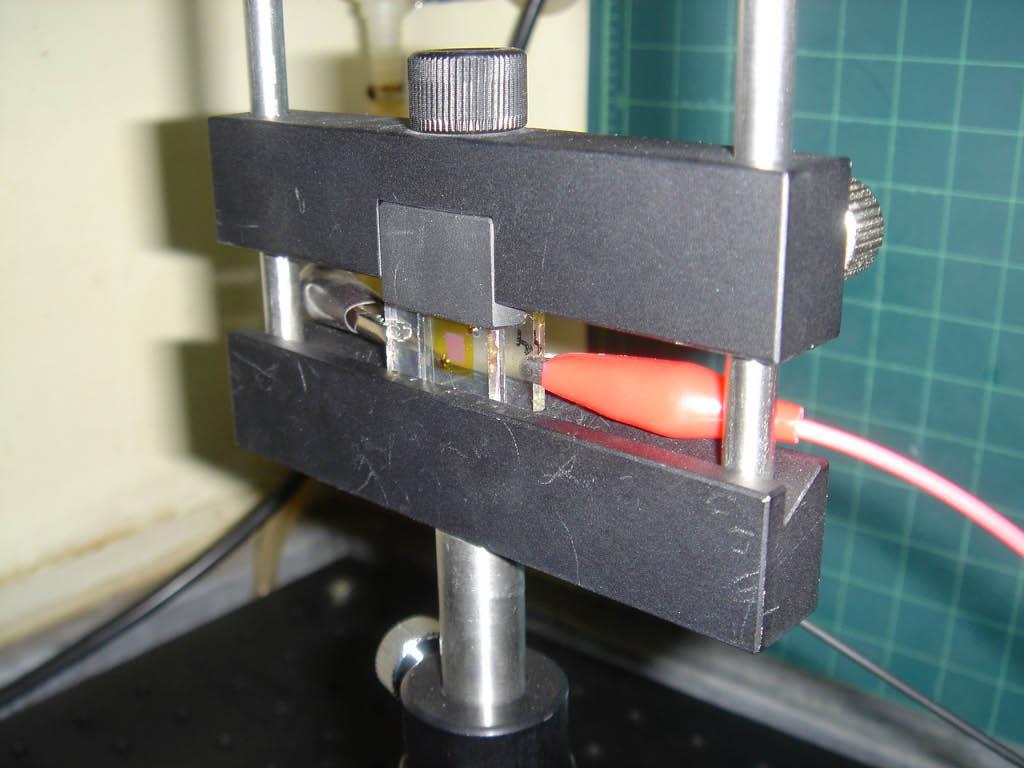
- (download) Dye-sensitized solar cell.jpg . . 1,024 × 768 . . 70 KB . . Oliver . . 19:43, 26 March 2013
- (download) EChem-copy-and-paste.jpg . . 80 × 49 . . 2 KB . . Oliver . . 17:40, 29 May 2013
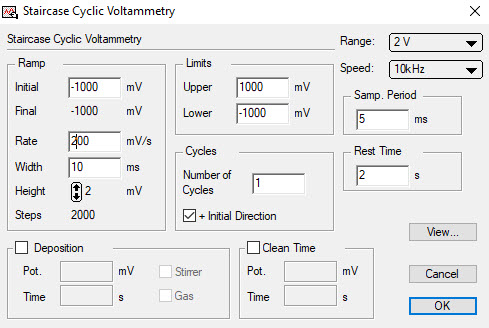
- (download) EChem CV settings for PMC.jpg . . 489 × 328 . . 55 KB . . Oliver . . 18:19, 13 August 2019
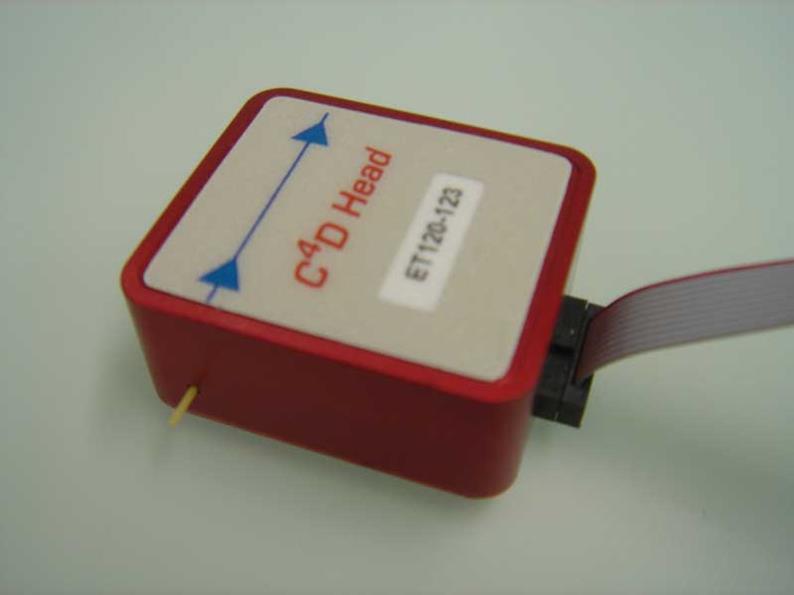
- (download) EDAQ 150 μm C4D Headstage.jpg . . 794 × 595 . . 23 KB . . Oliver . . 16:29, 8 July 2013
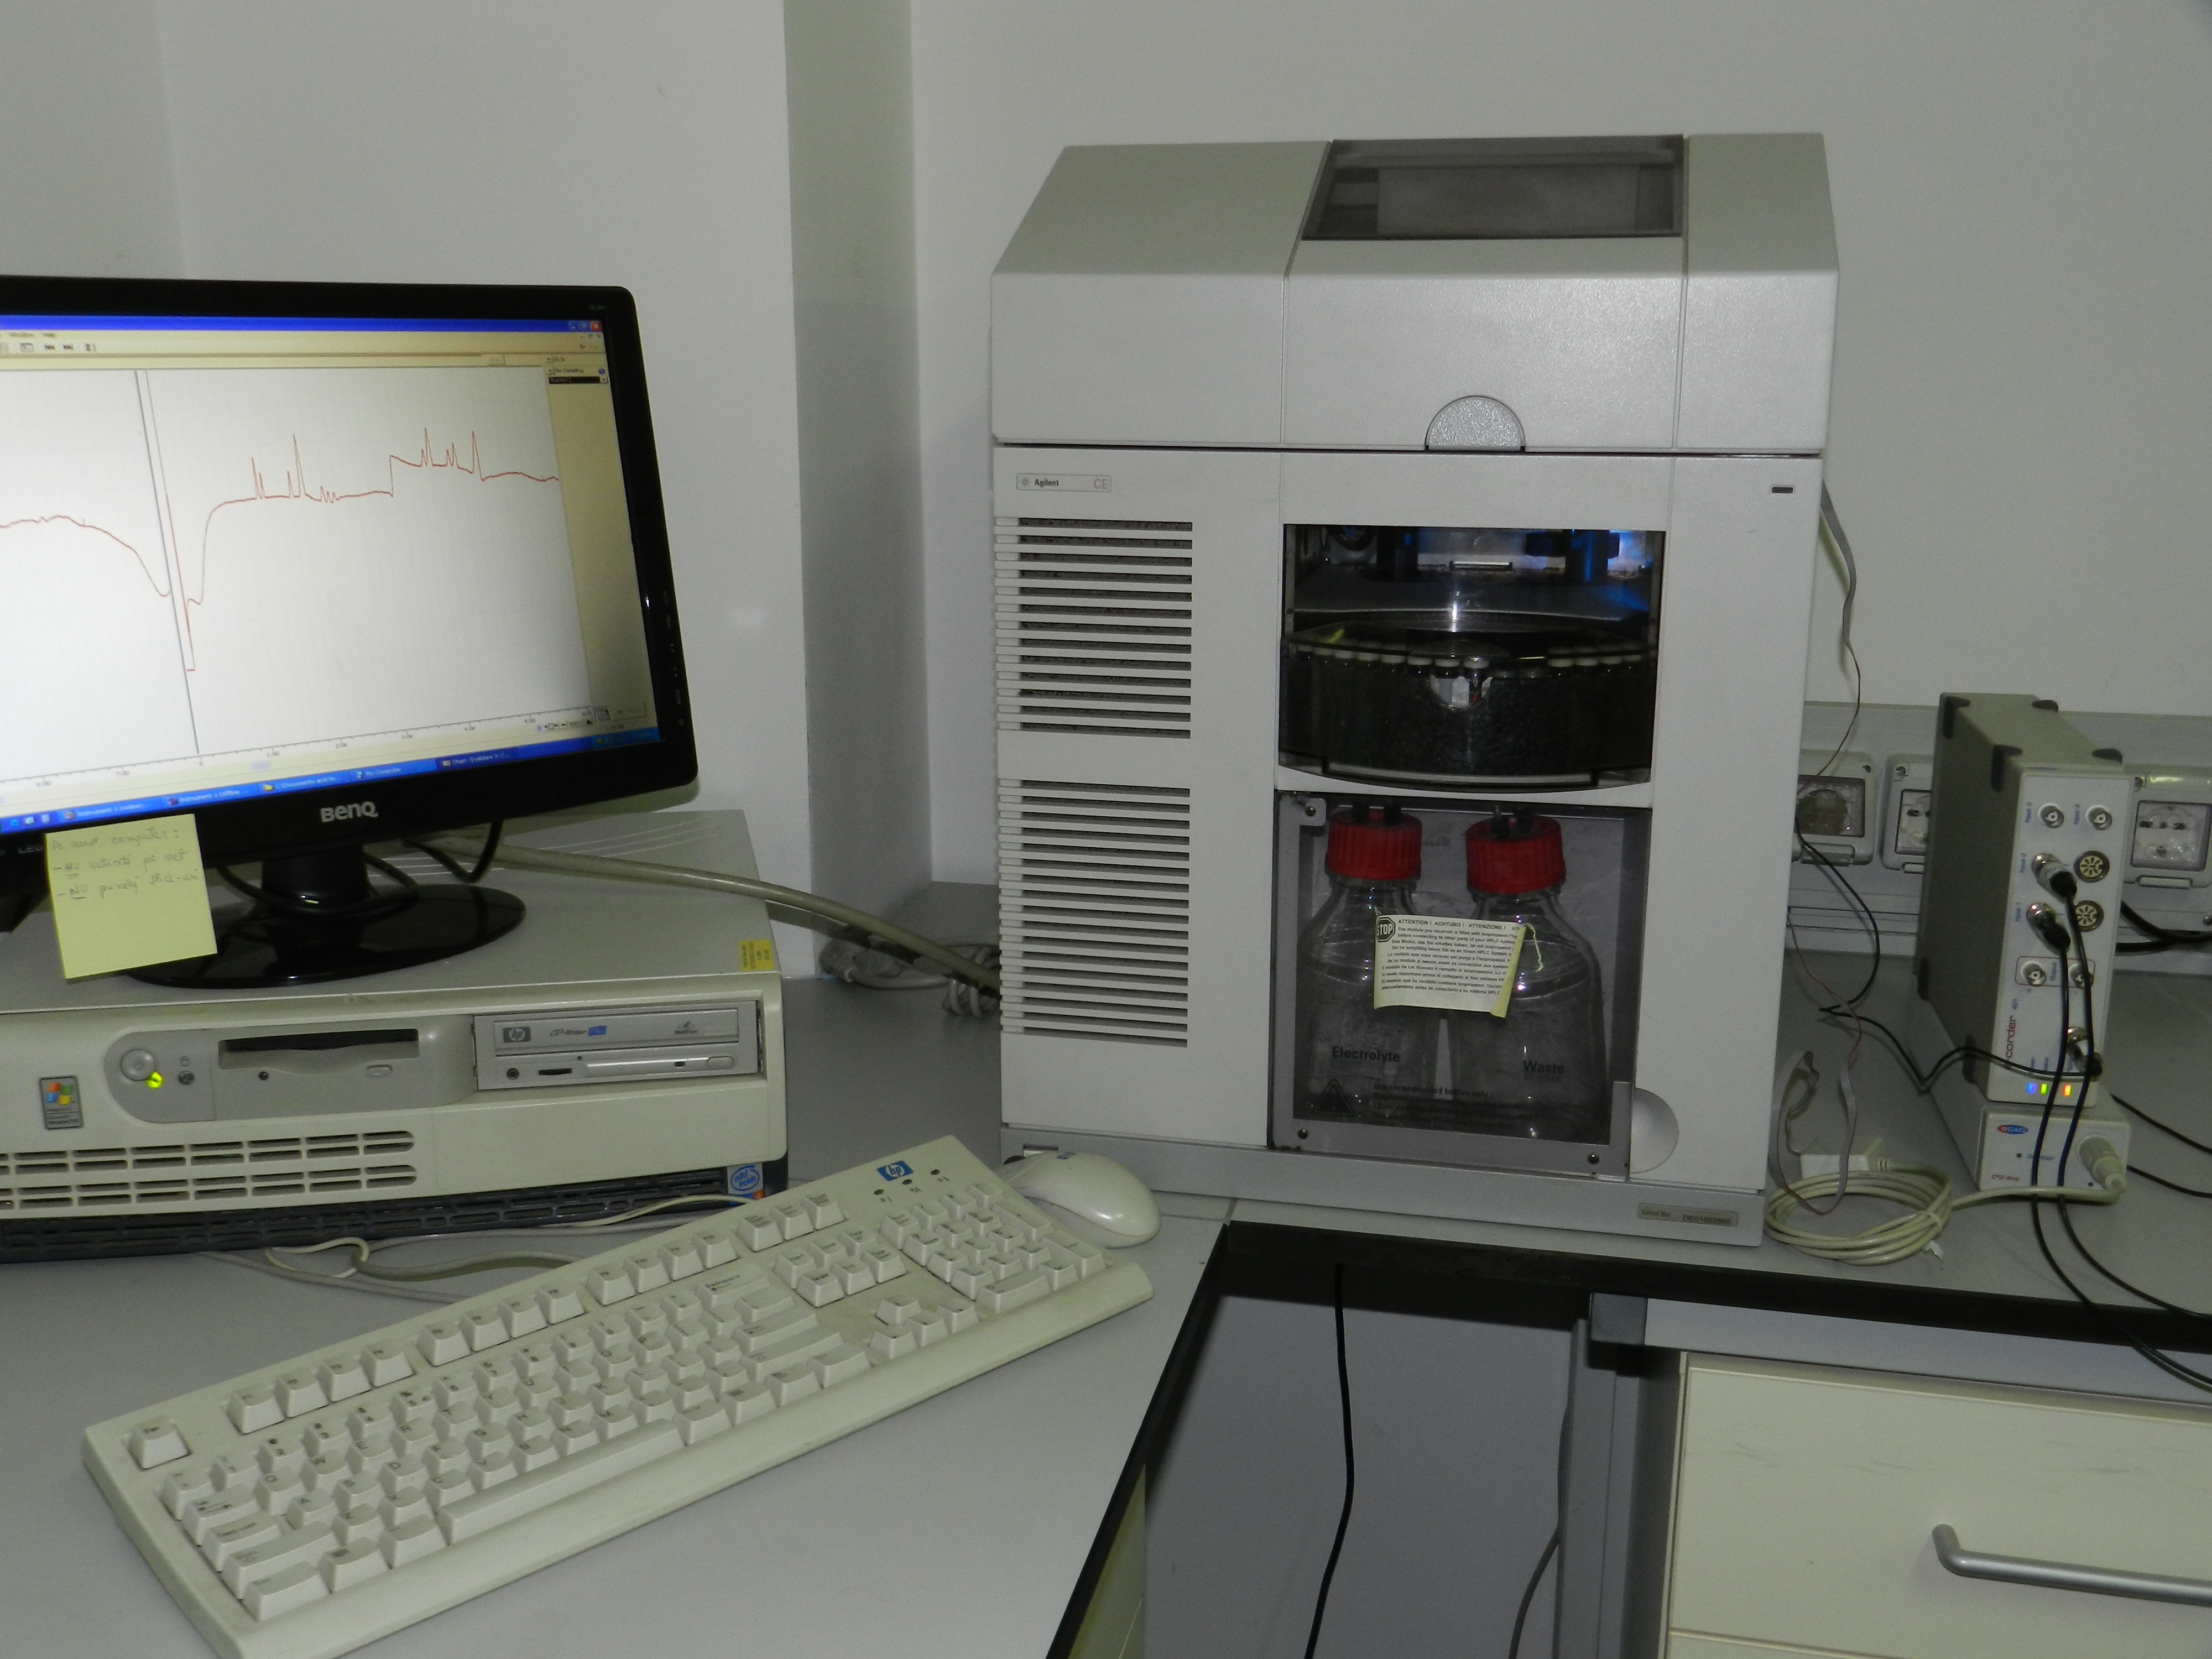
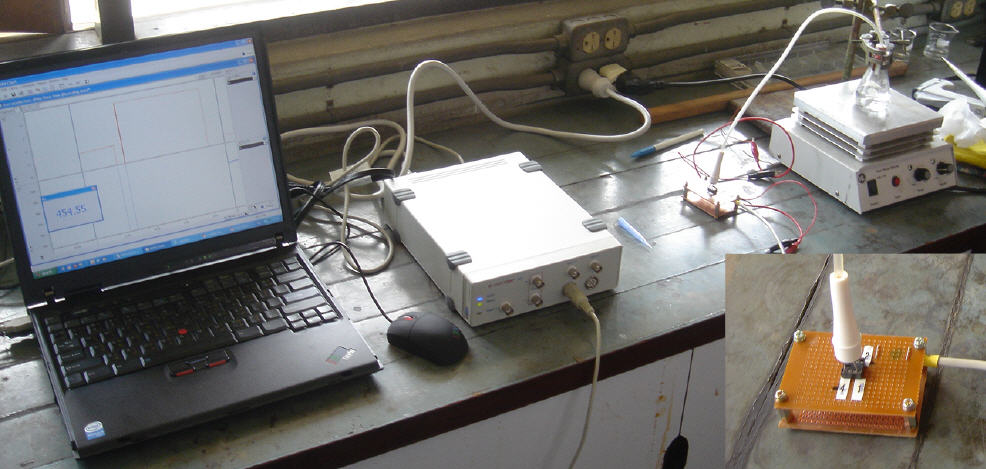
- (download) EDAQ C4D amp, Agilent 1600 CE.JPG . . 4,000 × 3,000 . . 4.36 MB . . Oliver . . 12:50, 27 August 2013
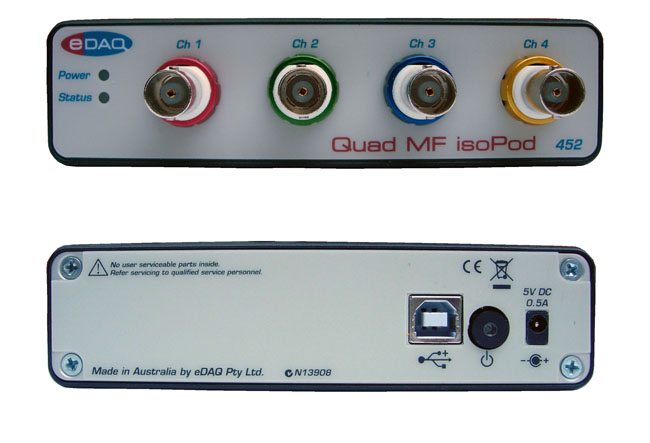
- (download) EPU452FrontBackSmall.jpg . . 650 × 443 . . 69 KB . . PaulDuckworth . . 18:35, 29 July 2015
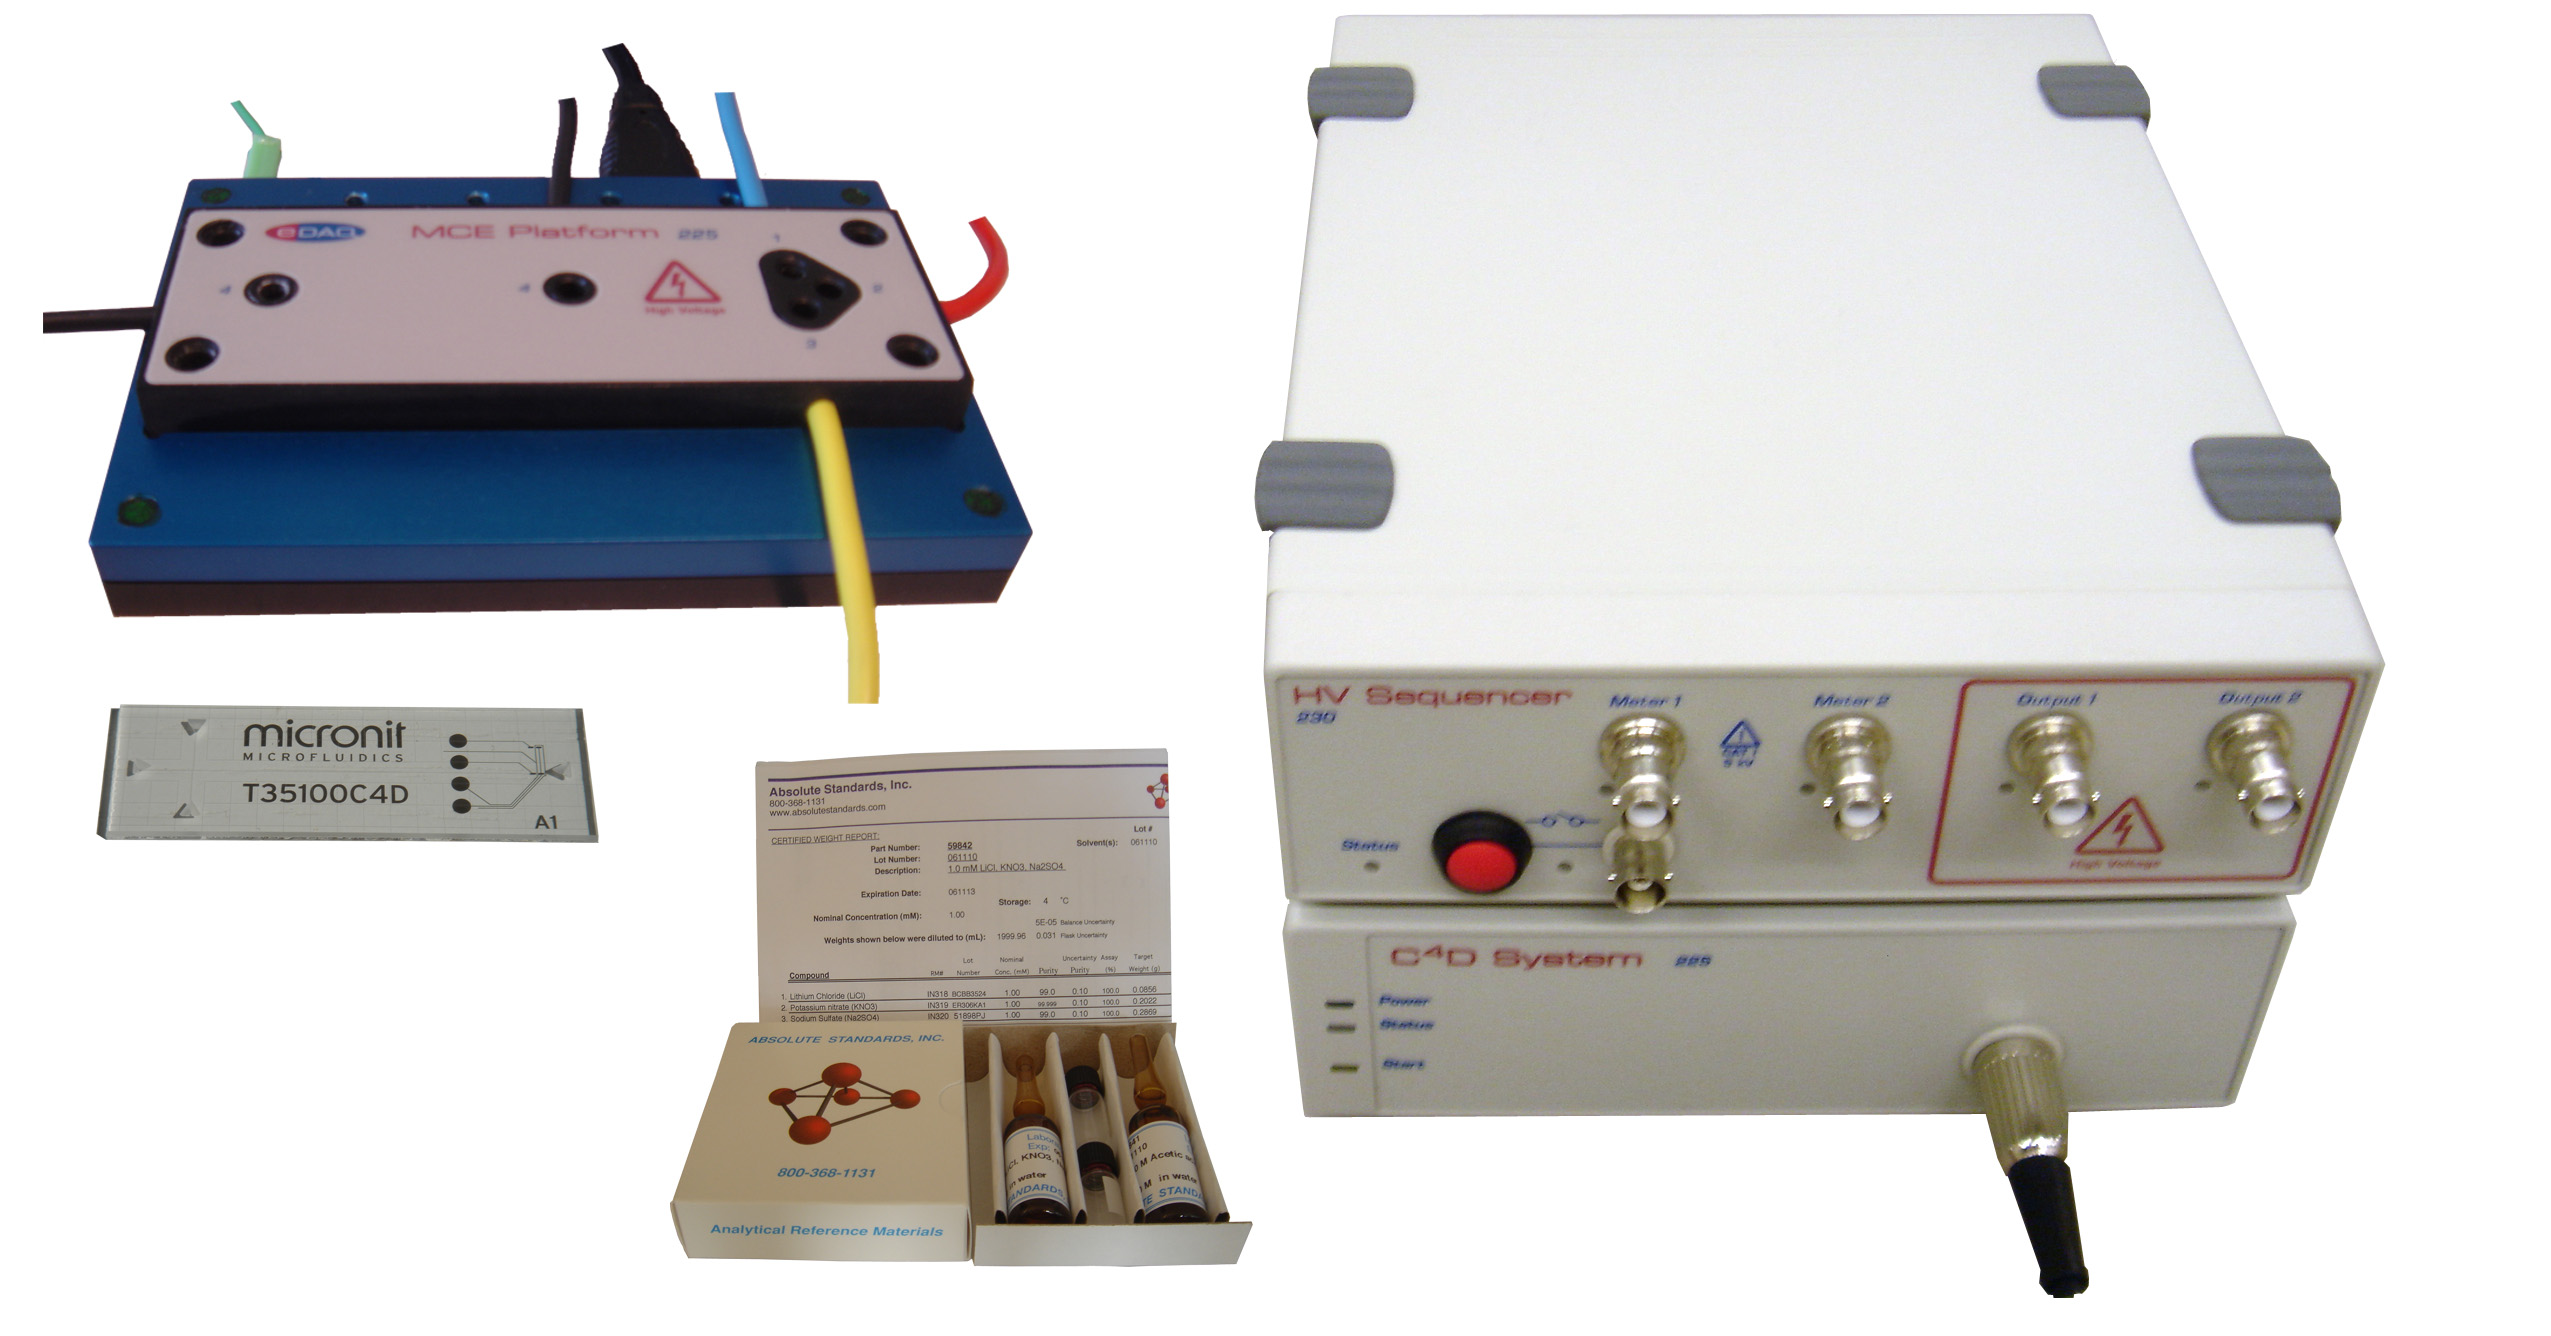
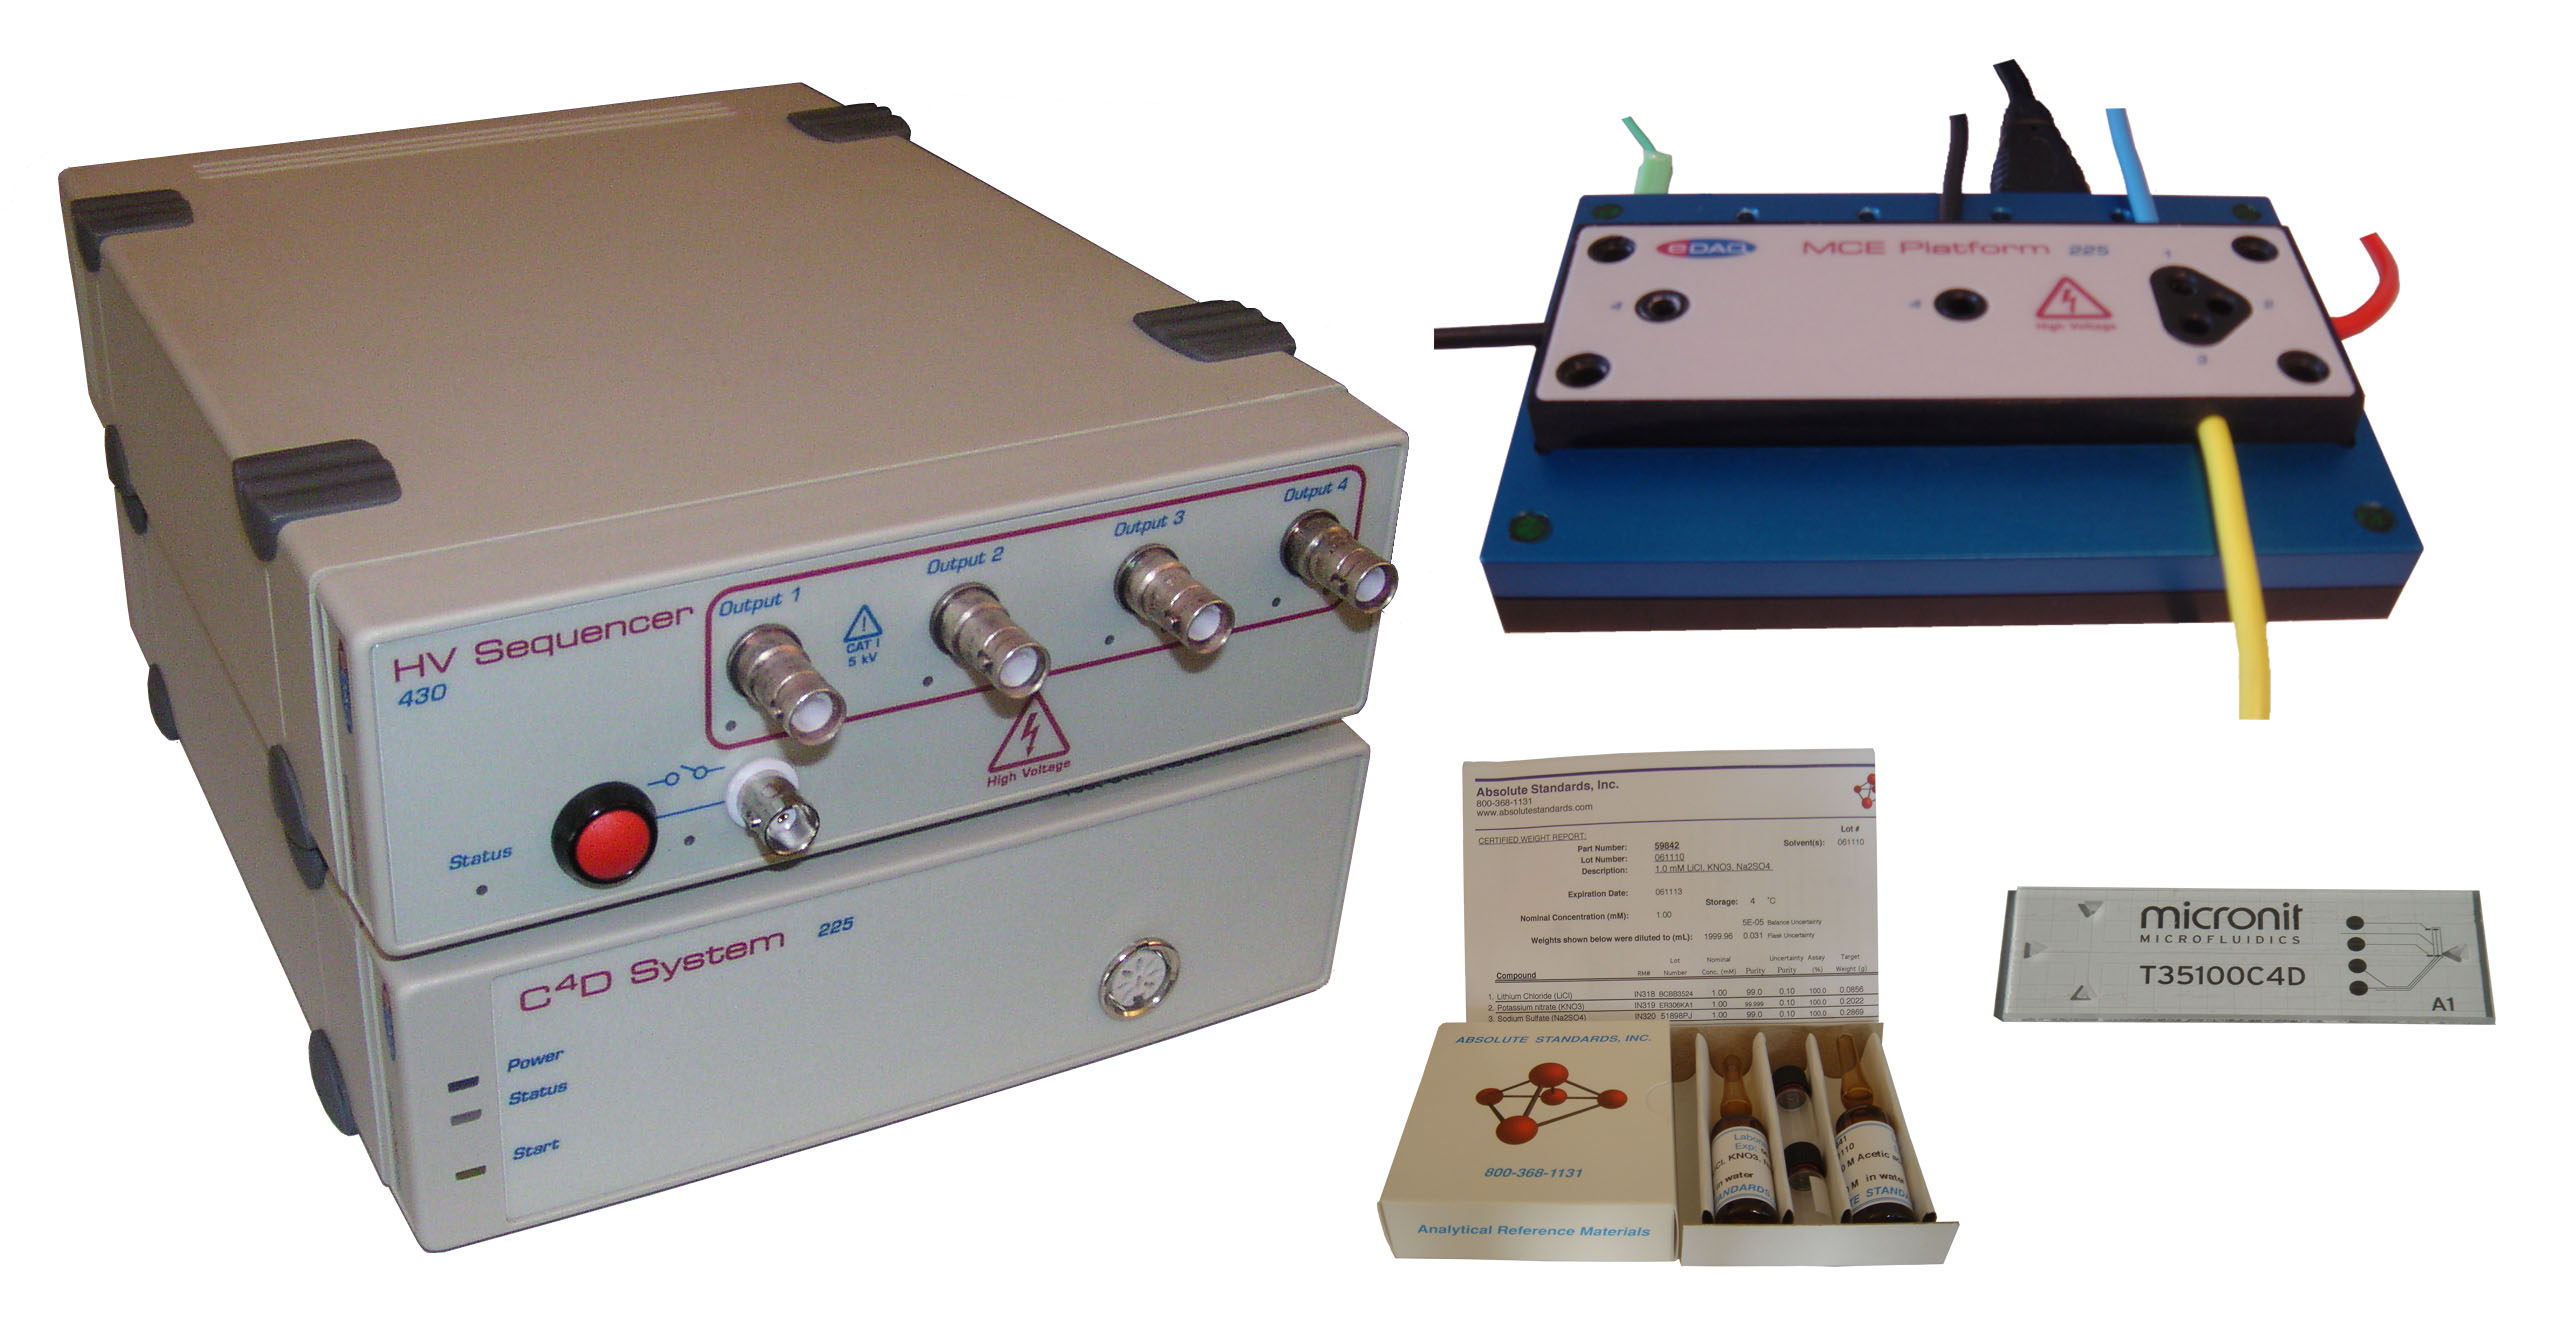
- (download) ER255,455.jpg . . 2,551 × 1,336 . . 443 KB . . Oliver . . 18:15, 8 July 2013
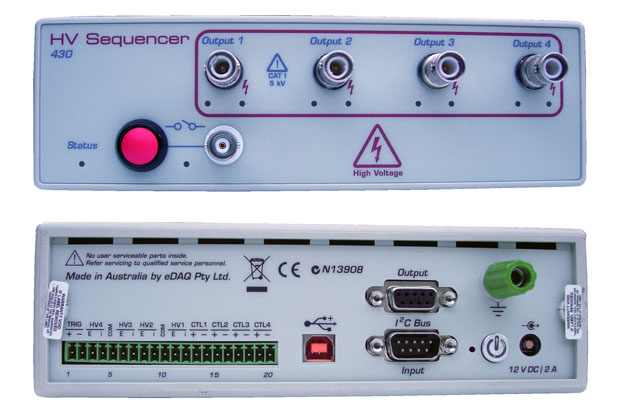
- (download) ER430SmallPanels.jpg . . 620 × 414 . . 76 KB . . PaulDuckworth . . 15:30, 6 August 2015
- (download) ER455.jpg . . 2,551 × 1,336 . . 330 KB . . Oliver . . 20:56, 14 October 2014
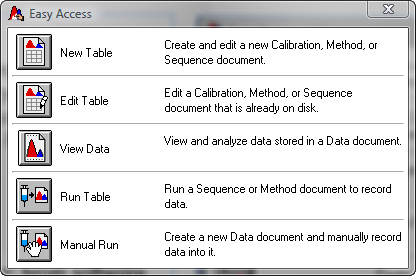
- (download) Easy access.jpg . . 416 × 276 . . 73 KB . . Oliver . . 20:52, 8 July 2013
- (download) Echem-computed-funtions.jpg . . 80 × 49 . . 2 KB . . Oliver . . 17:39, 29 May 2013
- (download) Echem-potentiostat-maintenance.jpg . . 80 × 49 . . 2 KB . . Oliver . . 17:15, 29 May 2013
- (download) Echem drawing baseline.jpg . . 80 × 49 . . 2 KB . . Oliver . . 17:35, 29 May 2013
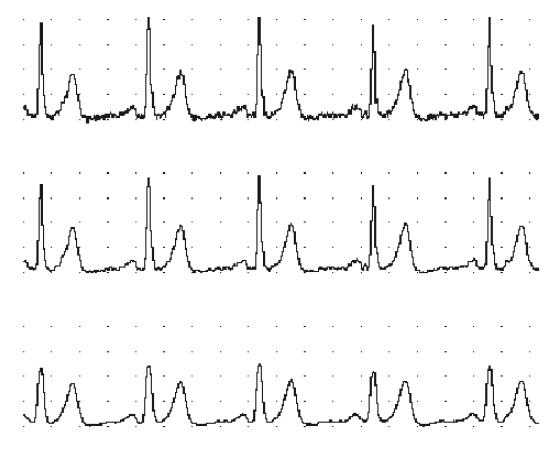
- (download) Effect of C4D frequency on peak shape, 1000 kHz.jpg . . 234 × 115 . . 12 KB . . Oliver . . 18:58, 19 December 2016
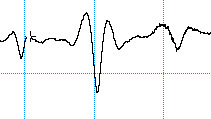
- (download) Effect of C4D frequency on peak shape, 250 kHz.jpg . . 211 × 119 . . 9 KB . . Oliver . . 18:57, 19 December 2016
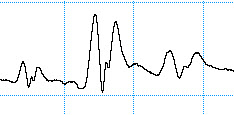
- (download) Effect of C4D frequency on peak shape, 700 kHz.jpg . . 246 × 148 . . 11 KB . . Oliver . . 18:58, 19 December 2016
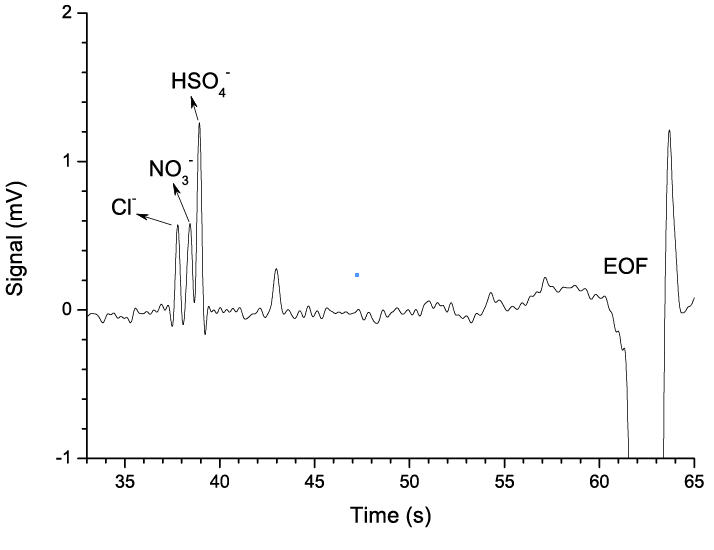
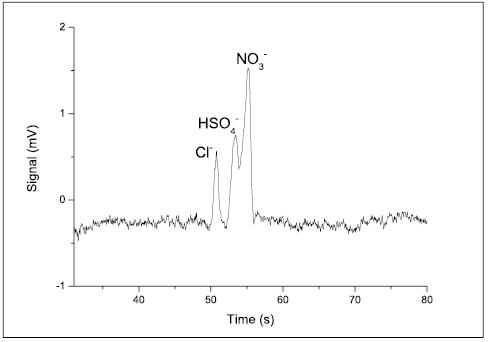
- (download) Electropherogram of 100 µM Cl–, NO3– and HSO4–.jpg . . 714 × 550 . . 28 KB . . Oliver . . 17:13, 8 July 2013
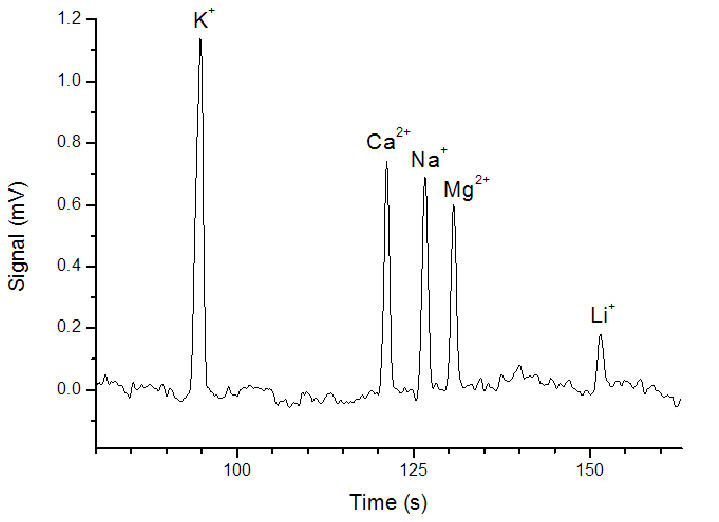
- (download) Electropherogram of 10 uM inorganic cations.jpg . . 719 × 522 . . 35 KB . . Oliver . . 16:53, 8 July 2013
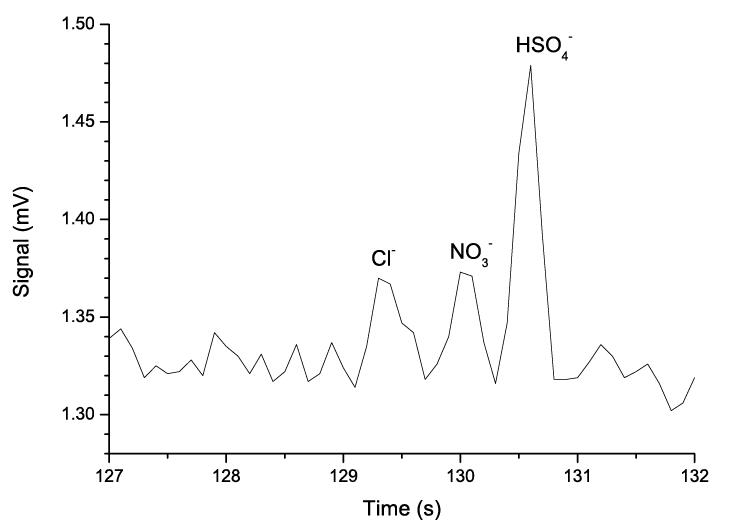
- (download) Electropherogram of 10 µM Cl–, NO3–, HSO4–.jpg . . 734 × 527 . . 27 KB . . Oliver . . 17:13, 8 July 2013
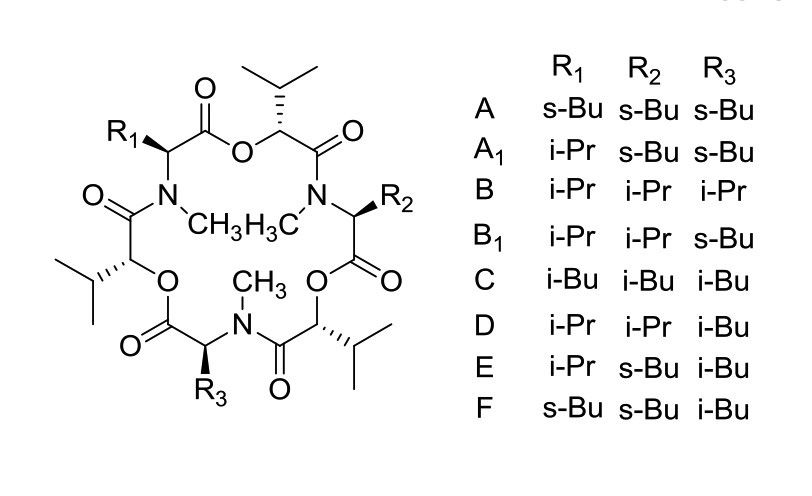
- (download) EnniatinComplex.jpg . . 812 × 496 . . 84 KB . . PaulDuckworth . . 18:00, 24 July 2013
- (download) Et225b.jpg . . 80 × 49 . . 3 KB . . Oliver . . 17:18, 10 June 2013
- (download) Example.jpg . . 589 × 821 . . 91 KB . . Nick . . 15:20, 17 February 2023
- (download) Fia extension.jpg . . 80 × 49 . . 2 KB . . Oliver . . 17:25, 10 June 2013
- (download) Fia print.jpg . . 80 × 49 . . 2 KB . . Oliver . . 17:25, 10 June 2013
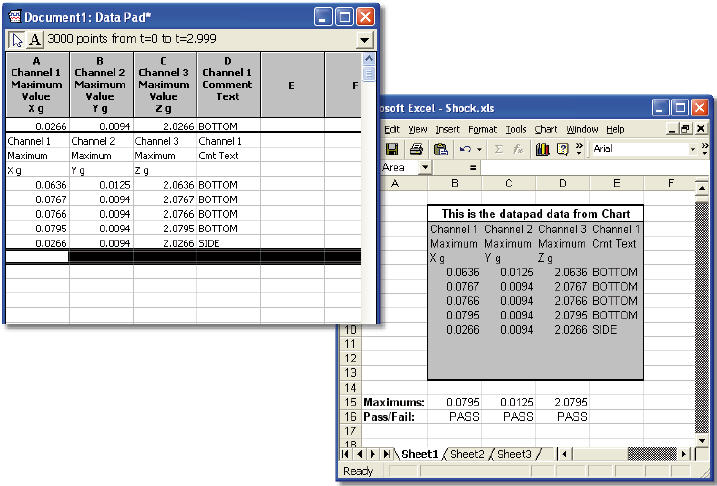
- (download) Figure 1. A selection of Chart data.jpg . . 687 × 473 . . 109 KB . . Oliver . . 12:45, 10 July 2013
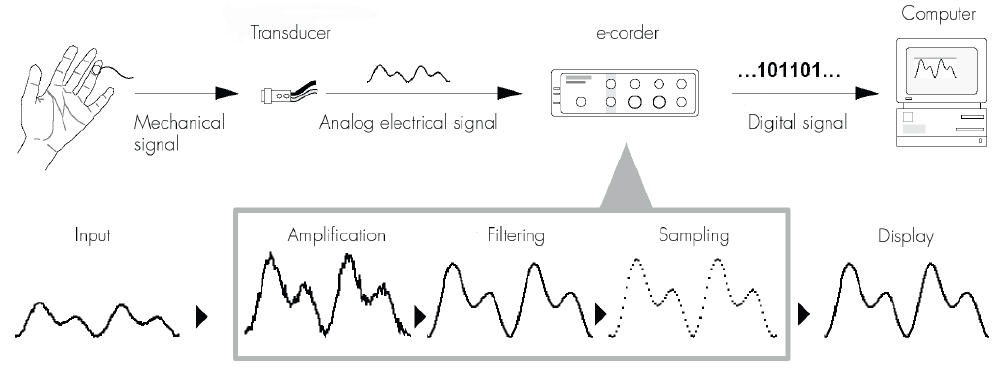
- (download) Figure 1. A summary of data acquisition using an e-corder system.jpg . . 1,005 × 369 . . 45 KB . . Oliver . . 22:44, 9 July 2013
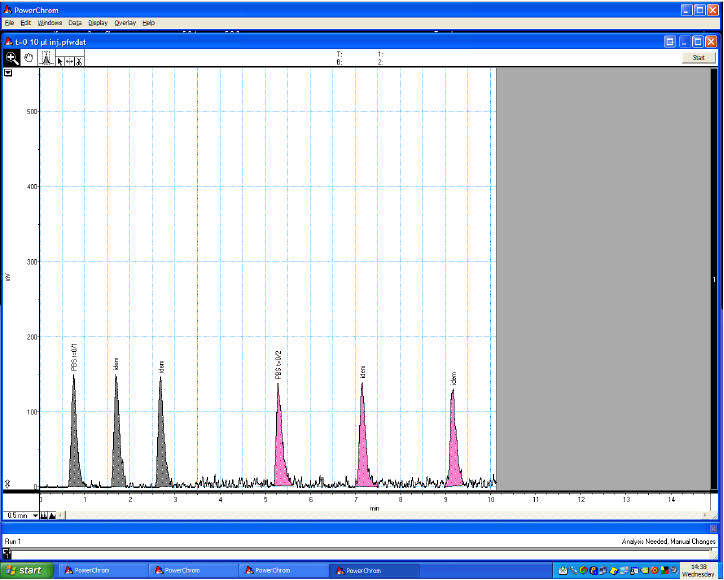
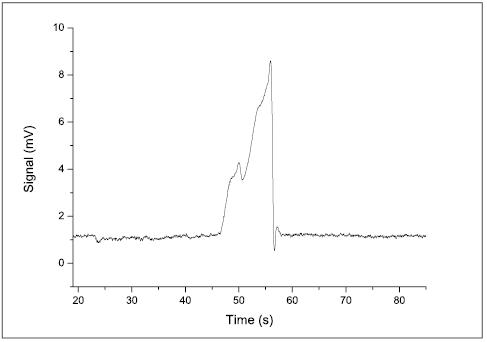
- (download) Figure 1. Electropherogram for one run..jpg . . 699 × 499 . . 36 KB . . Oliver . . 19:46, 8 July 2013
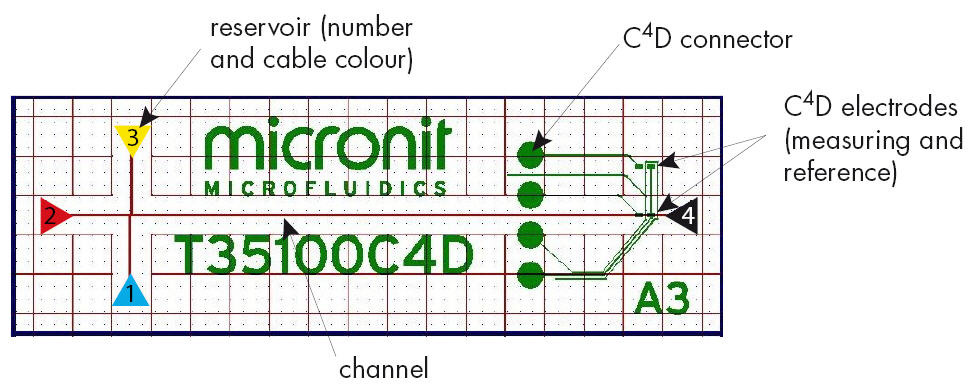
- (download) Figure 1. Microchip nomenclature.jpg . . 977 × 388 . . 84 KB . . Oliver . . 18:15, 8 July 2013
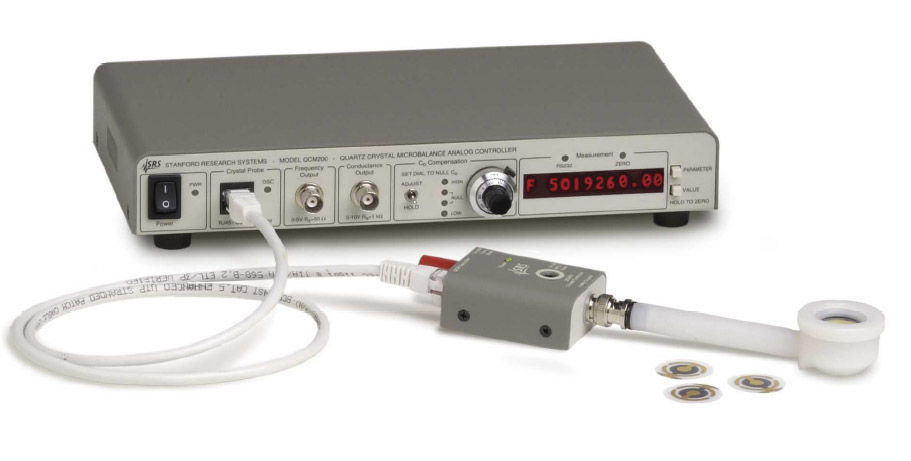
- (download) Figure 1. SRS QCM200 Quartz Crystal Microbalance.jpg . . 911 × 461 . . 68 KB . . Oliver . . 16:18, 9 July 2013
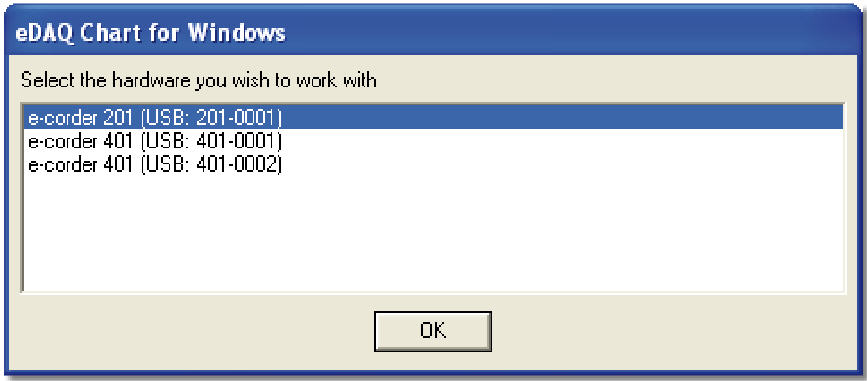
- (download) Figure 1. Select e-corder dialog box.jpg . . 867 × 381 . . 46 KB . . Oliver . . 14:09, 10 July 2013
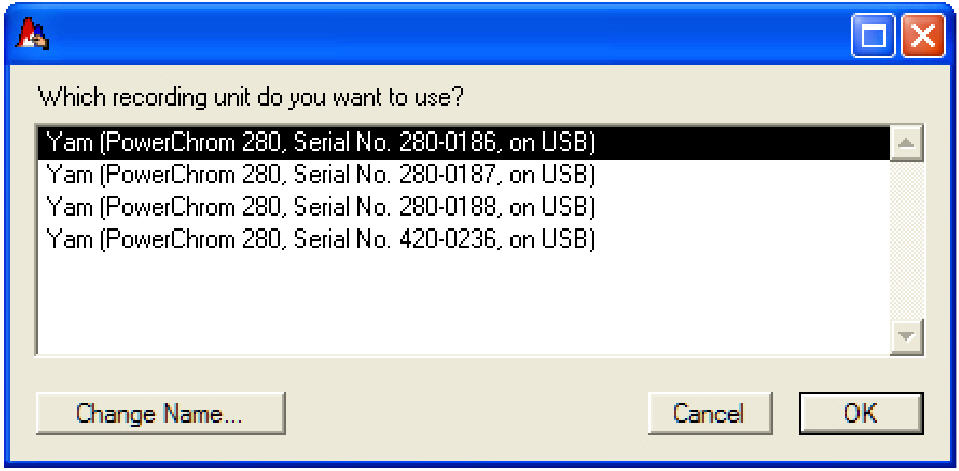
- (download) Figure 1. Select recorder window.jpg . . 959 × 471 . . 80 KB . . Oliver . . 14:27, 10 July 2013
- (download) Figure 1. Shimadzu SPD-6A UV detector.jpg . . 955 × 586 . . 67 KB . . Oliver . . 23:45, 8 July 2013
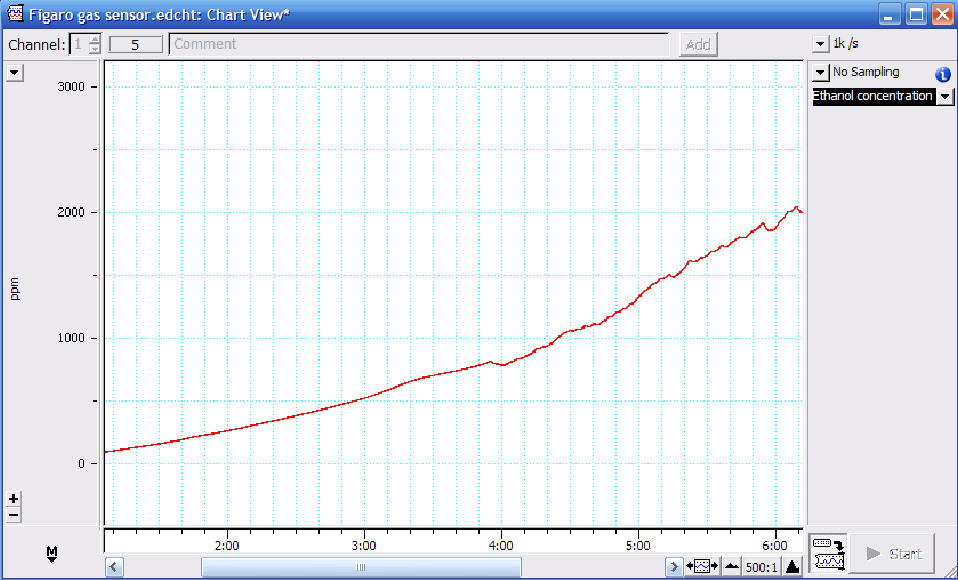
- (download) Figure 1. The Chart software gives a continuous live display of the gas concentration.jpg . . 958 × 580 . . 124 KB . . Oliver . . 00:45, 9 July 2013
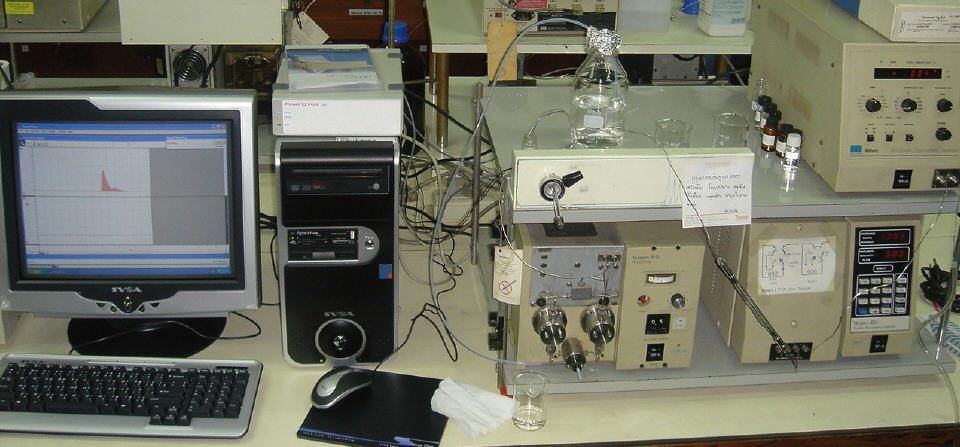
- (download) Figure 1. The ER280 PowerChrom System connected to a Waters HPLC.jpg . . 960 × 447 . . 90 KB . . Oliver . . 00:07, 9 July 2013
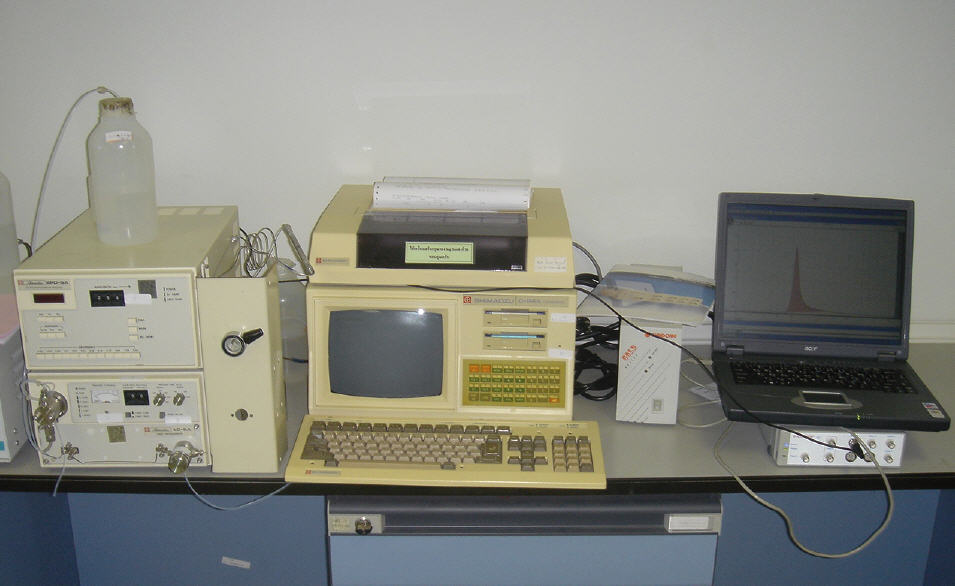
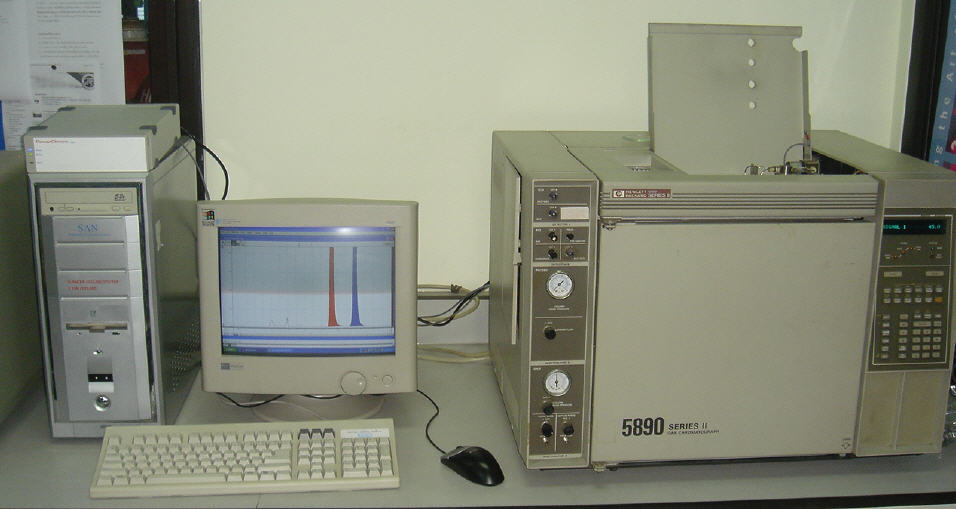
- (download) Figure 1. The PowerChrom System connected to the HP5890.jpg . . 956 × 509 . . 63 KB . . Oliver . . 23:54, 8 July 2013
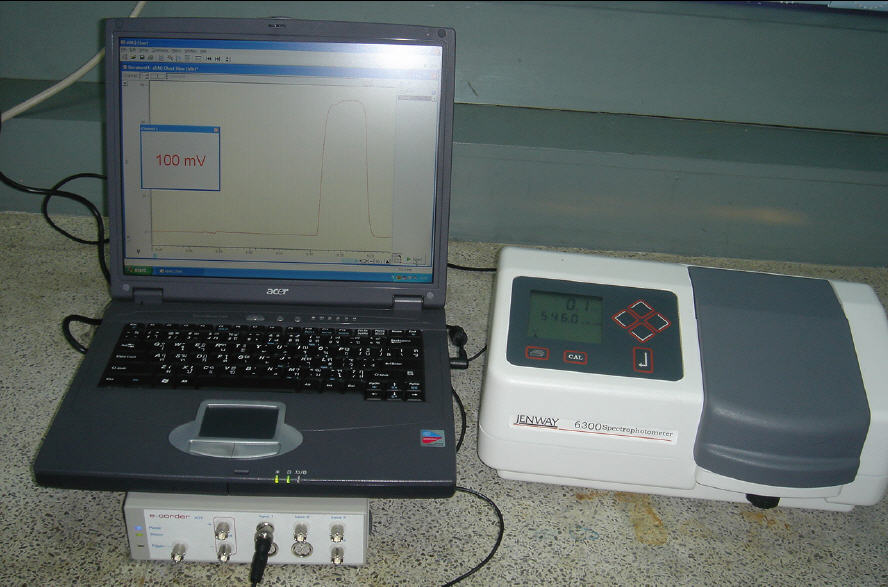
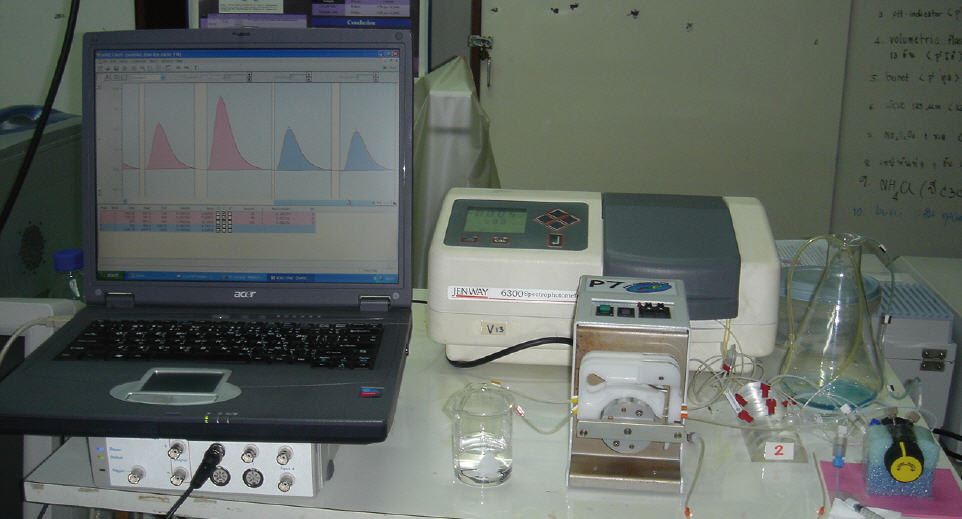
- (download) Figure 1. e-corder connected to Jenway 6300 spectrophotometer.jpg . . 888 × 587 . . 83 KB . . Oliver . . 00:51, 9 July 2013
- (download) Figure 1.jpg . . 925 × 677 . . 105 KB . . Nick . . 13:44, 14 March 2023
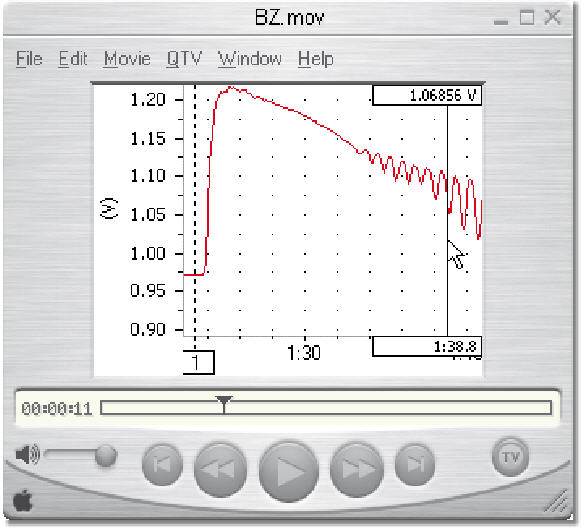
- (download) Figure 10. Chart data saved as a QuickTime™ movie using the “Save Selection” command.jpg . . 581 × 528 . . 52 KB . . Oliver . . 13:37, 10 July 2013
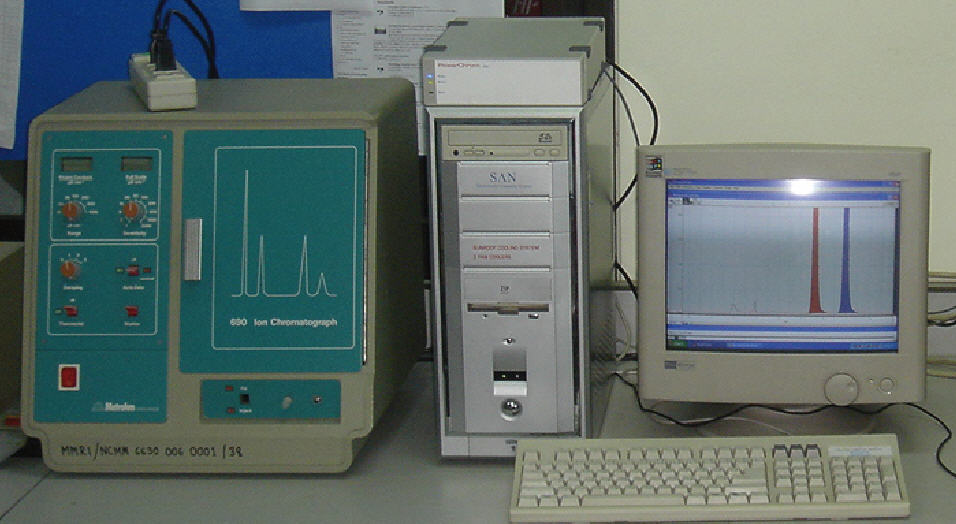
- (download) Figure 1a. The ER280 PowerChrom connected to the Metrohm 690 IC..jpg . . 956 × 524 . . 80 KB . . Oliver . . 00:27, 9 July 2013
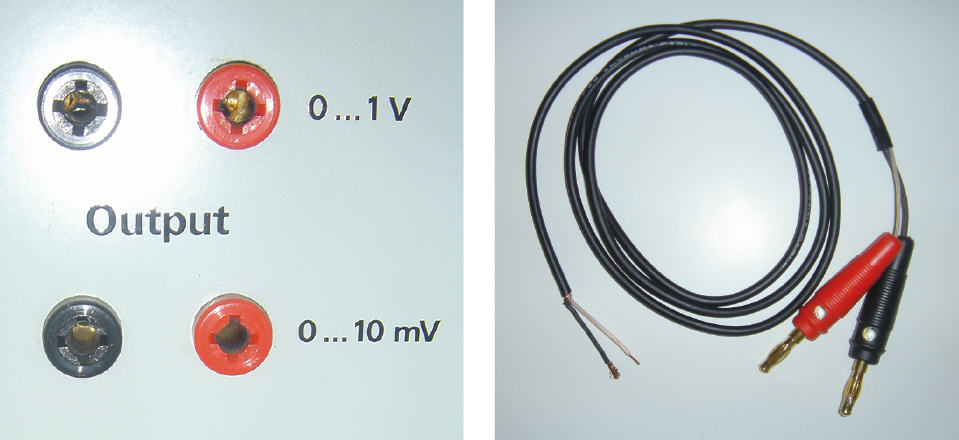
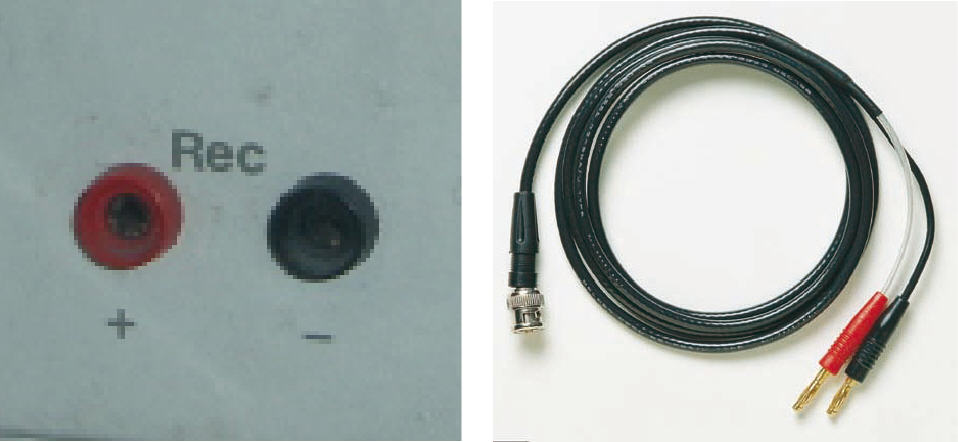
- (download) Figure 1b. The analog output of the IC instrument and banana plugs to bare wires cable..jpg . . 959 × 440 . . 53 KB . . Oliver . . 00:27, 9 July 2013
- (download) Figure 2. A microchip in the platform.JPG . . 640 × 480 . . 58 KB . . Oliver . . 15:58, 31 August 2015
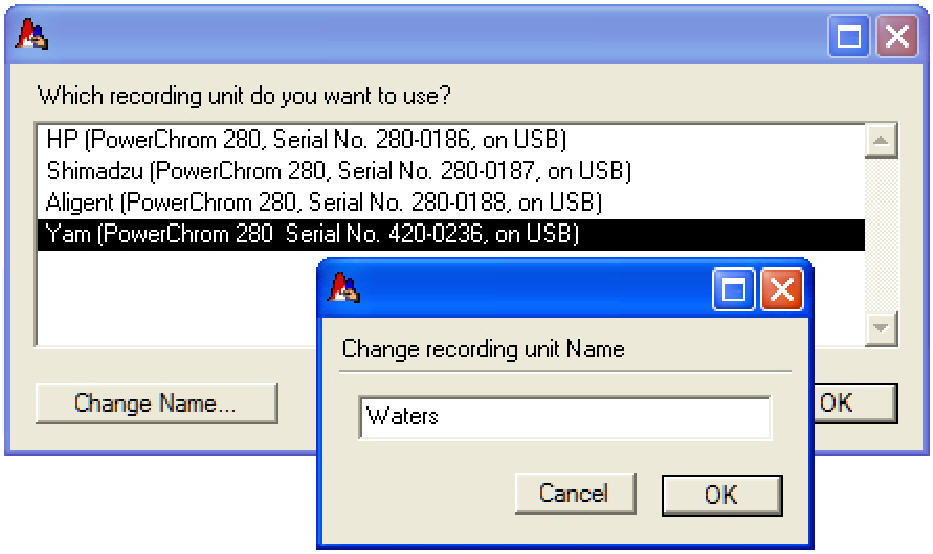
- (download) Figure 2. Change recording unit name window.jpg . . 933 × 554 . . 90 KB . . Oliver . . 14:27, 10 July 2013
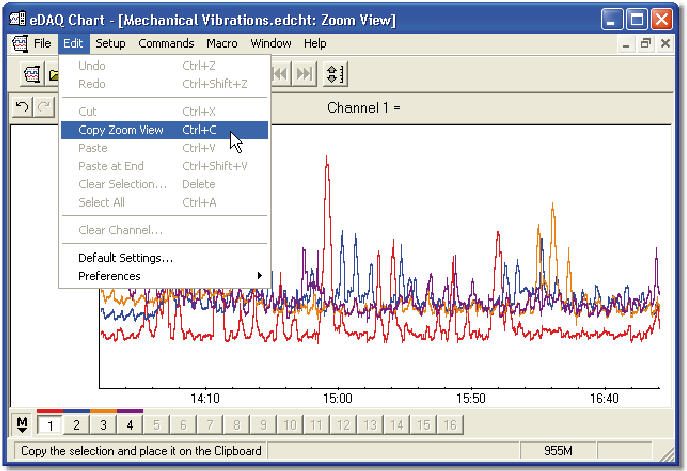
- (download) Figure 2. Copying the Zoom view as a graphic.jpg . . 687 × 471 . . 86 KB . . Oliver . . 12:45, 10 July 2013
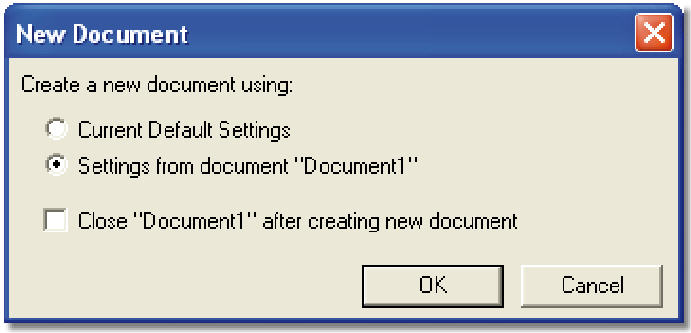
- (download) Figure 2. Create new document dialog box.jpg . . 691 × 333 . . 40 KB . . Oliver . . 14:09, 10 July 2013
- (download) Figure 2. Electropherogram while voltage is alternated back and forth..jpg . . 741 × 551 . . 49 KB . . Oliver . . 19:47, 8 July 2013
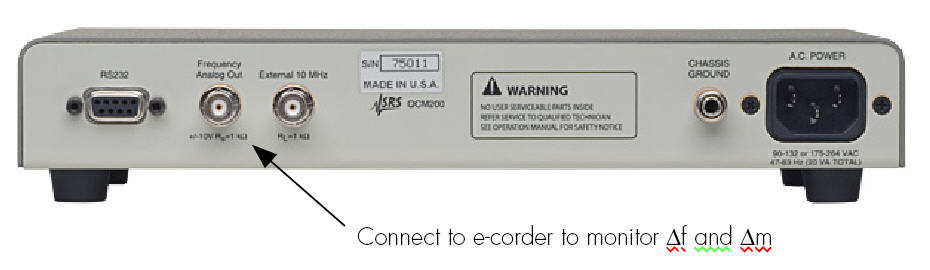
- (download) Figure 2. Rear of QCM200 unit.jpg . . 930 × 270 . . 32 KB . . Oliver . . 16:18, 9 July 2013
- (download) Figure 2. Shimadzu GC-14B.jpg . . 958 × 585 . . 92 KB . . Oliver . . 23:45, 8 July 2013
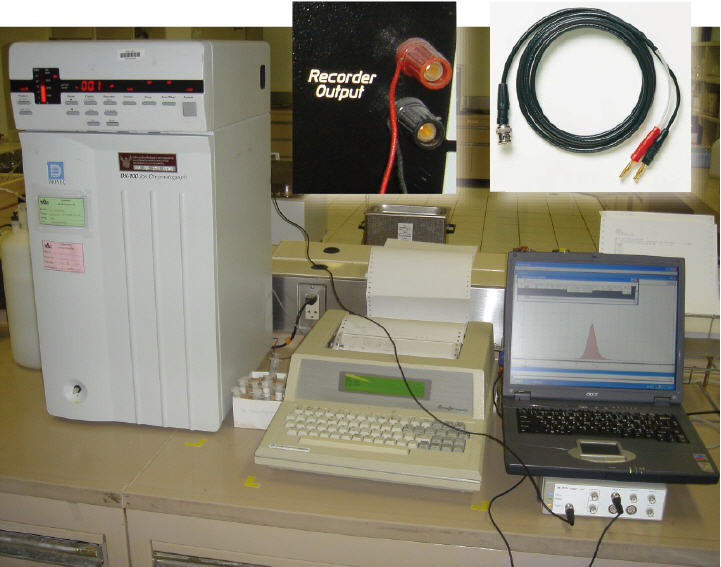
- (download) Figure 2. The e-corder is connected to the Dionex DX-100 ion chromatograph using a banana plugs to BNC cable..jpg . . 721 × 567 . . 64 KB . . Oliver . . 00:27, 9 July 2013
- (download) Figure 2. The ethanol in the flask is heated by the hotplate. The ethanol vapour travels through the tubing to the Figaro TGS 2620 sensor.jpg . . 986 × 469 . . 86 KB . . Oliver . . 00:43, 9 July 2013
- (download) Figure 2. The spectrophotometer’s analog output “Rec” is connected to the e-corder using a banana plugs to BNC cable.jpg . . 958 × 442 . . 46 KB . . Oliver . . 00:51, 9 July 2013
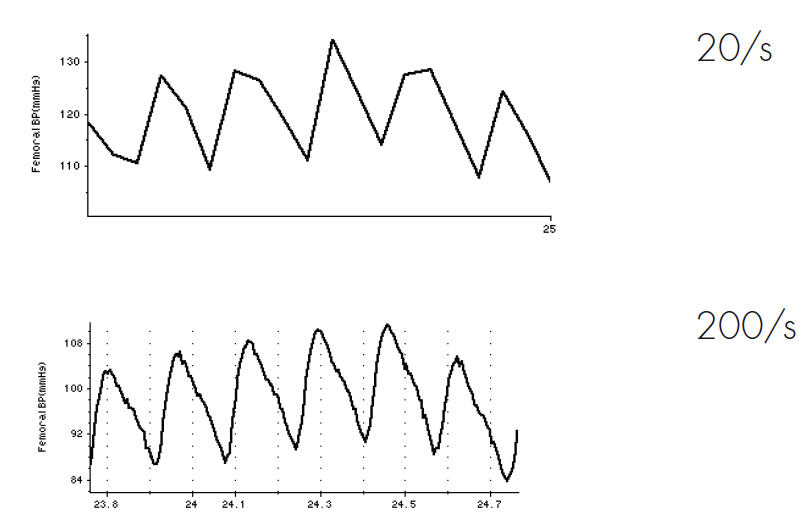
- (download) Figure 2. Undersampling, recording a signal at 20.jpg . . 812 × 522 . . 39 KB . . Oliver . . 22:44, 9 July 2013
- (download) Figure 2. Waters 430 Conductivity Detector.jpg . . 967 × 386 . . 52 KB . . Oliver . . 00:07, 9 July 2013
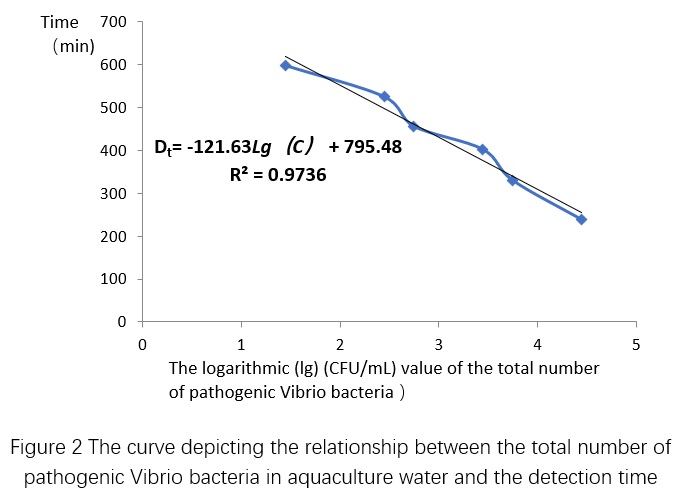
- (download) Figure 2.jpg . . 693 × 499 . . 56 KB . . Nick . . 13:45, 14 March 2023
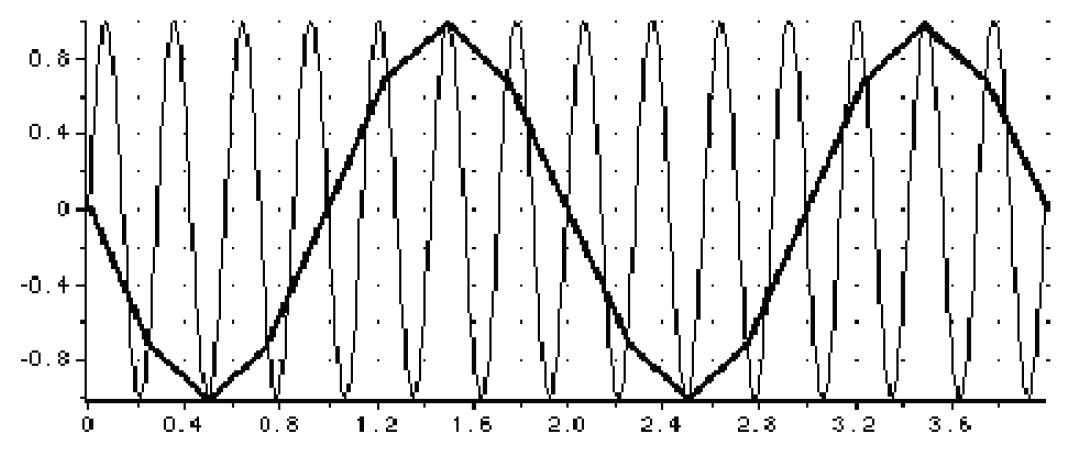
- (download) Figure 3. Aliasing, sampling a 3.5 Hz signal at 4.jpg . . 1,079 × 453 . . 73 KB . . Oliver . . 22:44, 9 July 2013
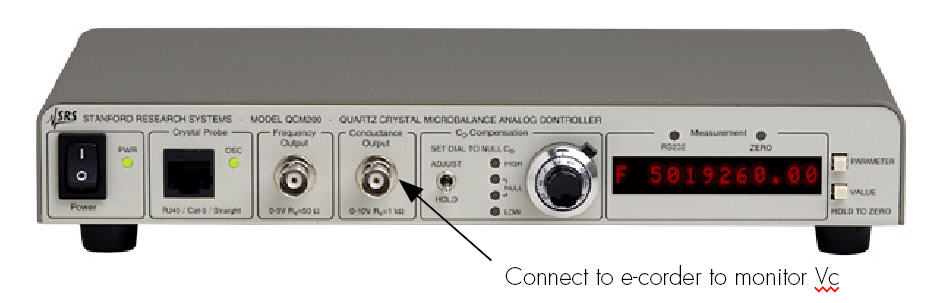
- (download) Figure 3. Front of QCM200 unit.jpg . . 929 × 303 . . 38 KB . . Oliver . . 16:18, 9 July 2013
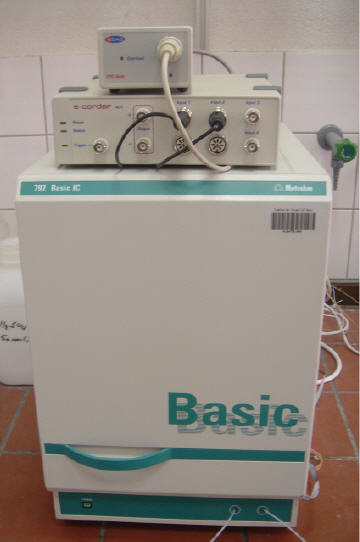
- (download) Figure 3. Metrohm 792 Basic IC with eDAQ C4D.jpg . . 360 × 542 . . 24 KB . . Oliver . . 00:27, 9 July 2013
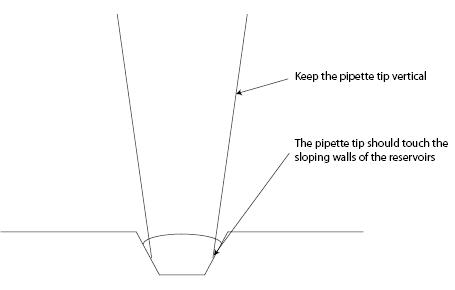
- (download) Figure 3. Pipetting solutions into the microchip reservoirs.jpg . . 455 × 290 . . 11 KB . . Oliver . . 18:15, 8 July 2013
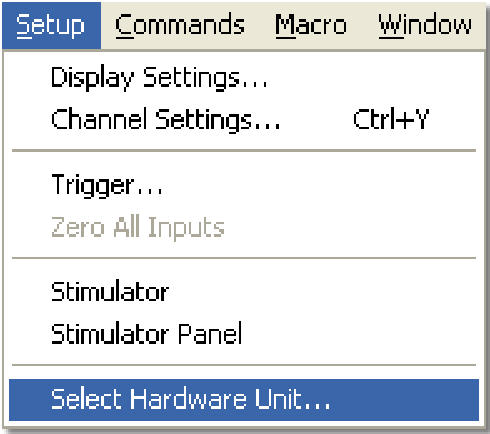
- (download) Figure 3. Select Hardware Unit Command.jpg . . 490 × 434 . . 37 KB . . Oliver . . 14:09, 10 July 2013
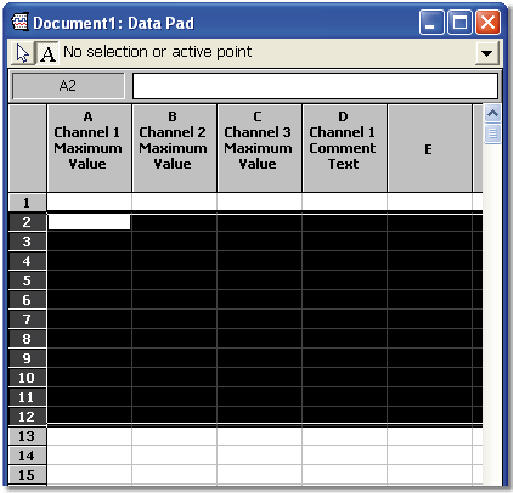
- (download) Figure 3. Selecting the Data Pad cells to link.jpg . . 513 × 493 . . 50 KB . . Oliver . . 12:45, 10 July 2013
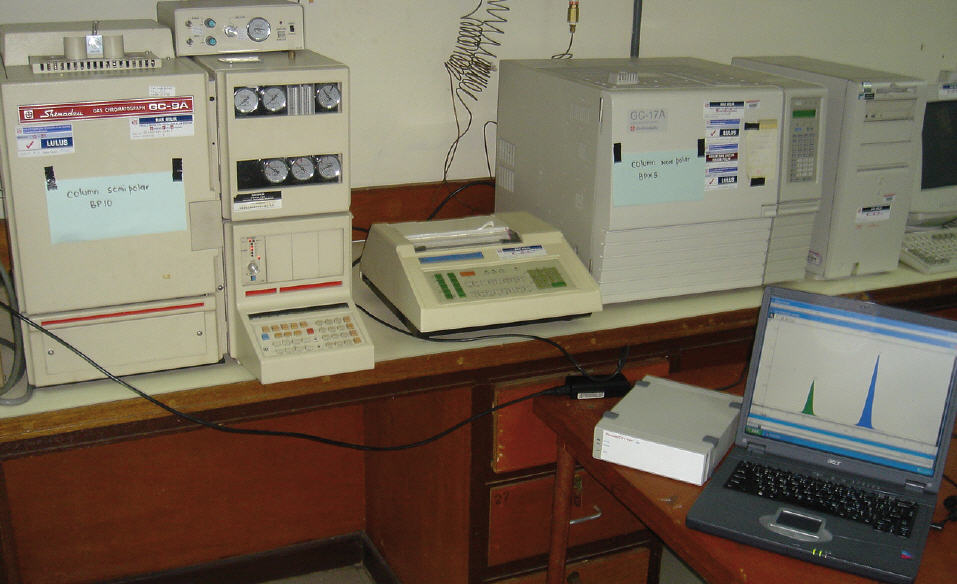
- (download) Figure 3. Shimadzu GC-9A and GC-17A.jpg . . 957 × 584 . . 88 KB . . Oliver . . 23:45, 8 July 2013
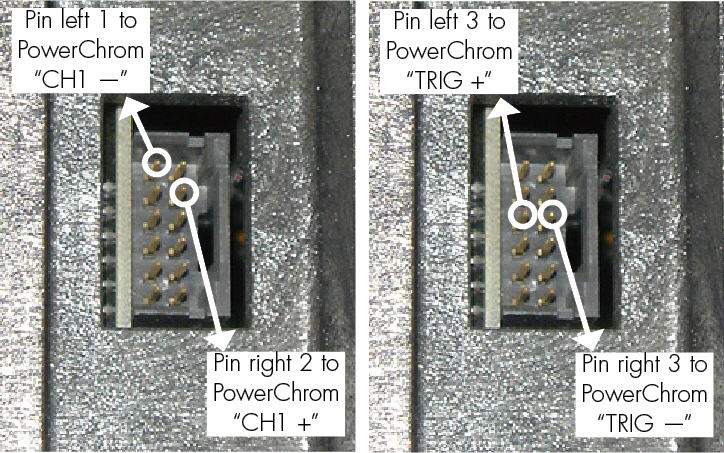
- (download) Figure 3. Signal output and Remote output.jpg . . 724 × 453 . . 112 KB . . Oliver . . 23:54, 8 July 2013
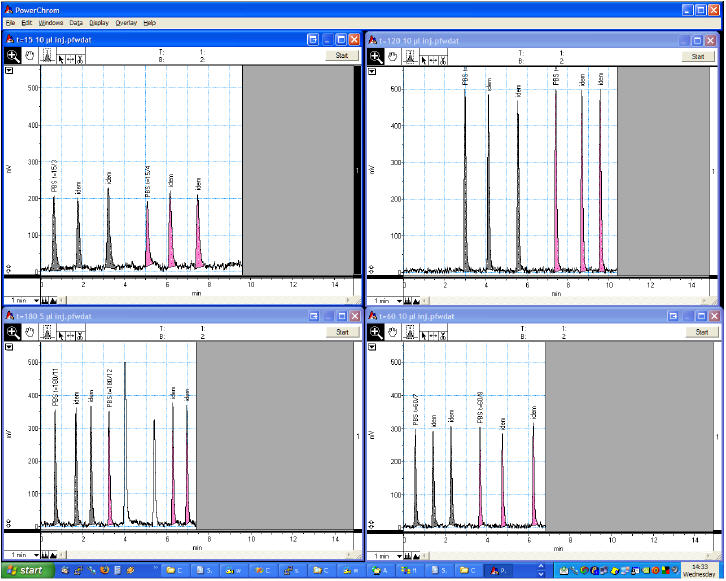
- (download) Figure 3. Stacked PowerChrom windows.jpg . . 724 × 580 . . 90 KB . . Oliver . . 14:27, 10 July 2013
- (download) Figure 3. The pump pushes the solution through the flow cell in the spectrophotometer. The change in absorbance is recorded by the e-corder.jpg . . 962 × 519 . . 72 KB . . Oliver . . 00:51, 9 July 2013
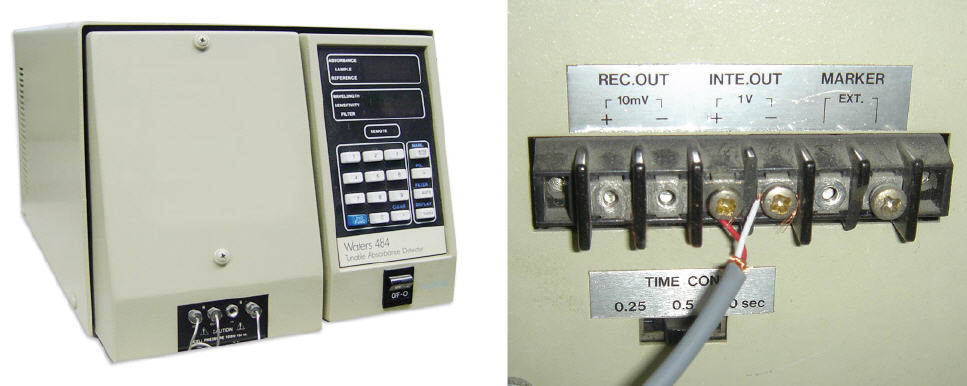
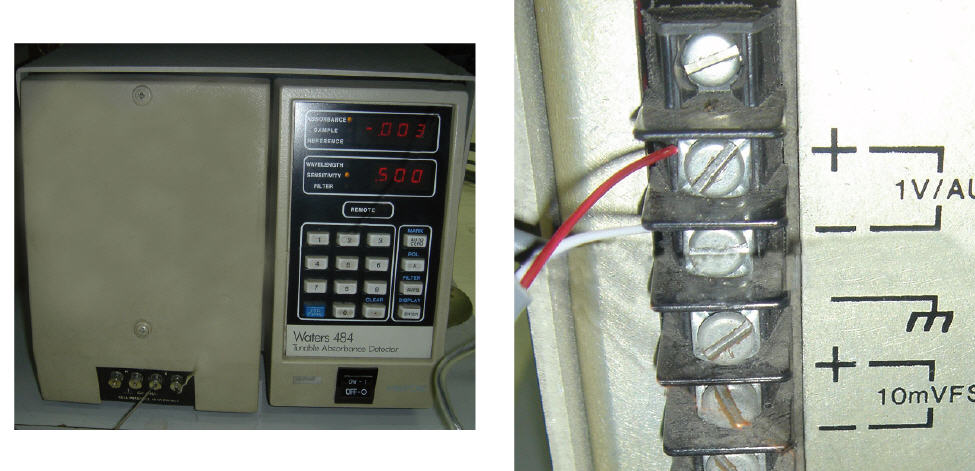
- (download) Figure 3. Waters 484 Tunable Absorbance Detector.jpg . . 975 × 471 . . 77 KB . . Oliver . . 00:07, 9 July 2013
- (download) Figure 3.jpg . . 675 × 465 . . 54 KB . . Nick . . 13:43, 14 March 2023
- (download) Figure 4. Cations at 100 µM concentration.jpg . . 488 × 345 . . 16 KB . . Oliver . . 18:15, 8 July 2013
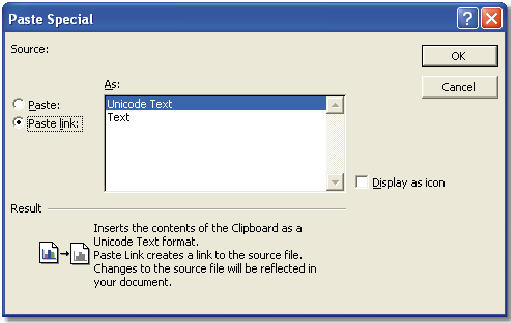
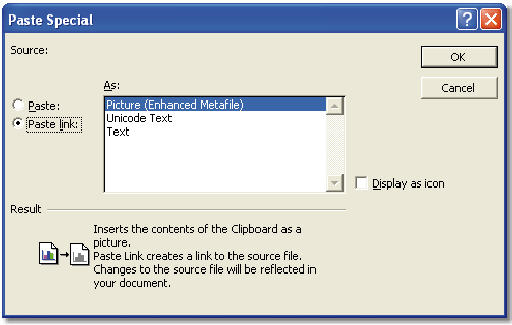
- (download) Figure 4. Excel’s “Paste Special” dialog box.jpg . . 511 × 323 . . 28 KB . . Oliver . . 12:45, 10 July 2013
- (download) Figure 4. External Detector Adapter from Beckman Coulter.jpg . . 562 × 605 . . 55 KB . . Oliver . . 14:17, 19 July 2013
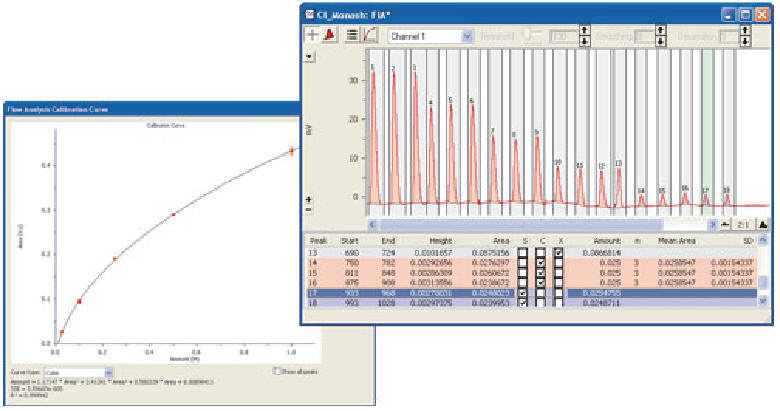
- (download) Figure 4. FIA extension integrates the peaks, fits a calibration curve and produces a report.jpg . . 780 × 411 . . 55 KB . . Oliver . . 00:51, 9 July 2013
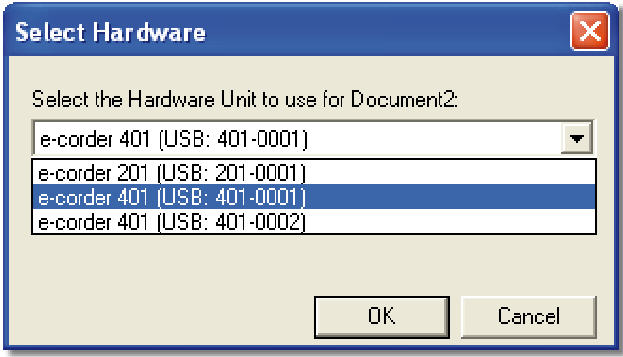
- (download) Figure 4. Select Hardware Unit dialog box.jpg . . 623 × 357 . . 45 KB . . Oliver . . 14:09, 10 July 2013
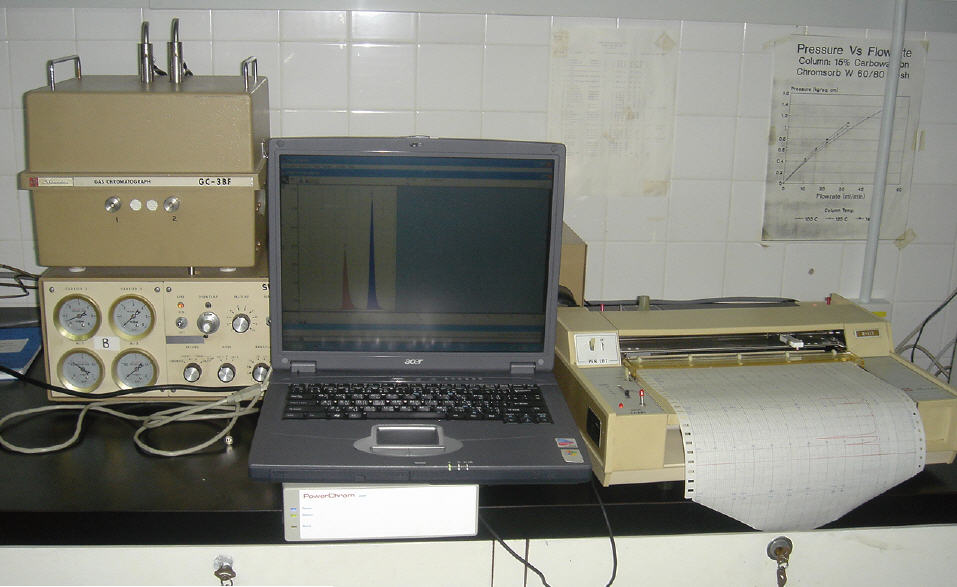
- (download) Figure 4. Shimadzu GC-3BF.jpg . . 957 × 587 . . 79 KB . . Oliver . . 23:45, 8 July 2013
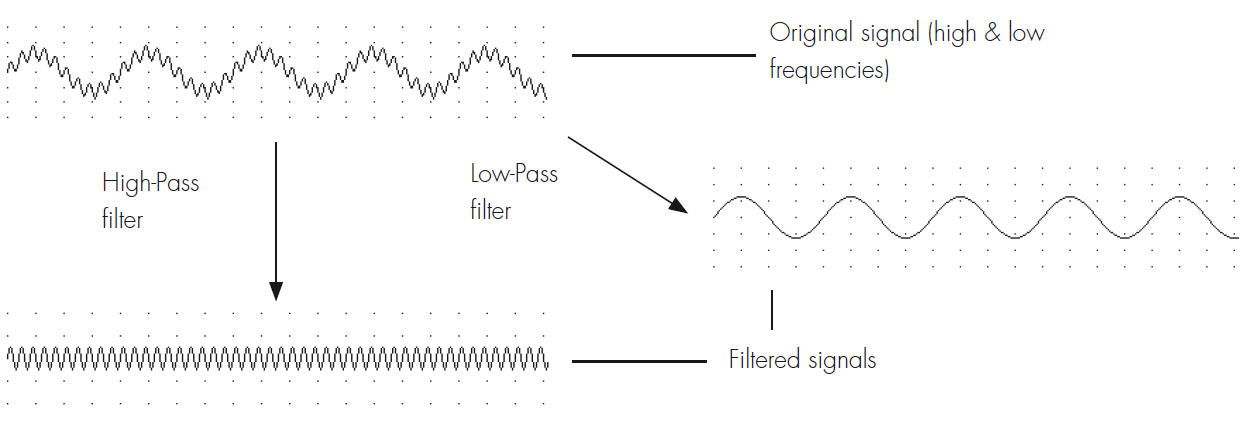
- (download) Figure 4. The effects of filtering on a mixed-frequency signal.jpg . . 1,251 × 422 . . 53 KB . . Oliver . . 22:44, 9 July 2013
- (download) Figure 4. Tiled PowerChrom windows.jpg . . 726 × 581 . . 102 KB . . Oliver . . 14:27, 10 July 2013
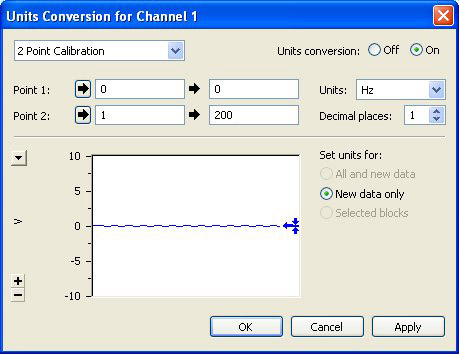
- (download) Figure 4. Units Conversion Window.jpg . . 459 × 354 . . 64 KB . . Oliver . . 16:49, 9 July 2013
- (download) Figure 4. Waters injection valve.jpg . . 547 × 406 . . 27 KB . . Oliver . . 00:07, 9 July 2013
- (download) Figure 5. A signal with various low-pass filter settings.jpg . . 558 × 451 . . 31 KB . . Oliver . . 22:44, 9 July 2013
- (download) Figure 5. Anions overloading at 1 mM concentration.jpg . . 487 × 342 . . 13 KB . . Oliver . . 18:15, 8 July 2013
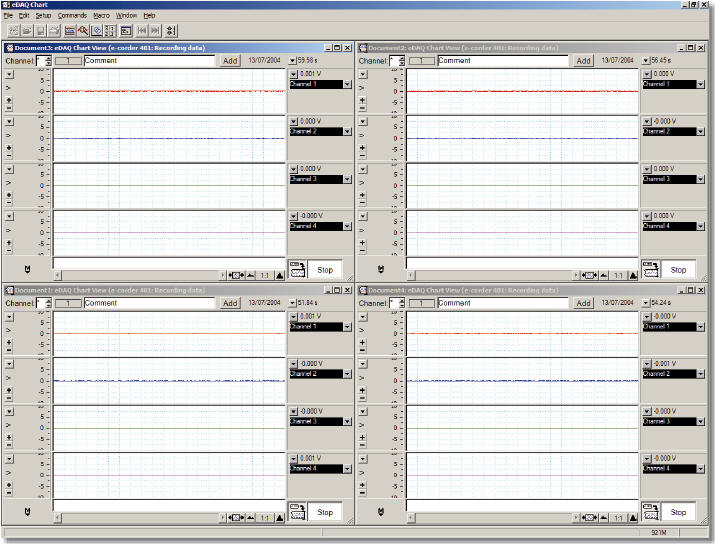
- (download) Figure 5. Chart recording data from four separate e-corders.jpg . . 715 × 544 . . 98 KB . . Oliver . . 14:09, 10 July 2013
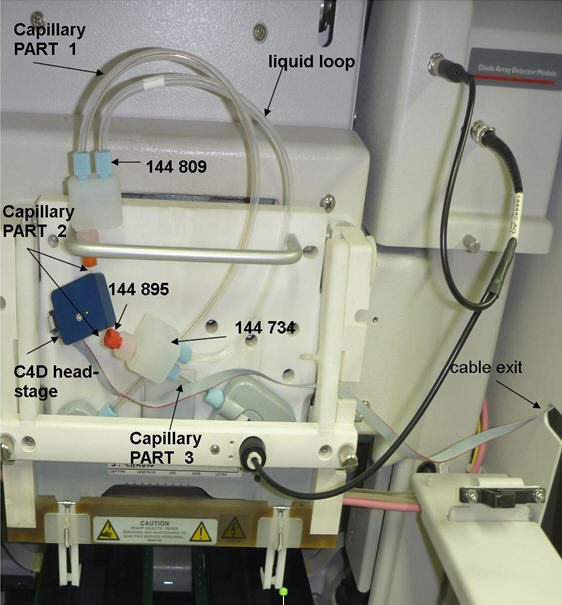
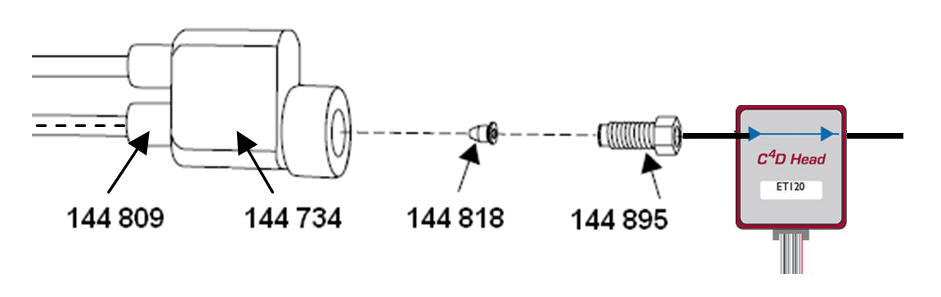
- (download) Figure 5. Connections of the capillary with the screws and gaskets.jpg . . 941 × 297 . . 24 KB . . Oliver . . 14:17, 19 July 2013
- (download) Figure 5. Pasting Chart link into Excel.jpg . . 479 × 490 . . 56 KB . . Oliver . . 12:45, 10 July 2013
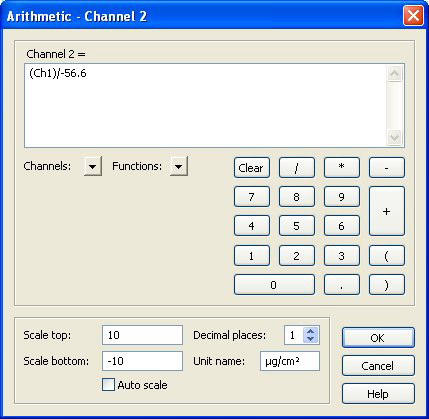
- (download) Figure 5. Use this expression if using 200 and 500 Hz Scale Factor.jpg . . 429 × 419 . . 72 KB . . Oliver . . 16:18, 9 July 2013
- (download) Figure 6. Anions at 100 µM concentration.jpg . . 489 × 342 . . 15 KB . . Oliver . . 18:16, 8 July 2013
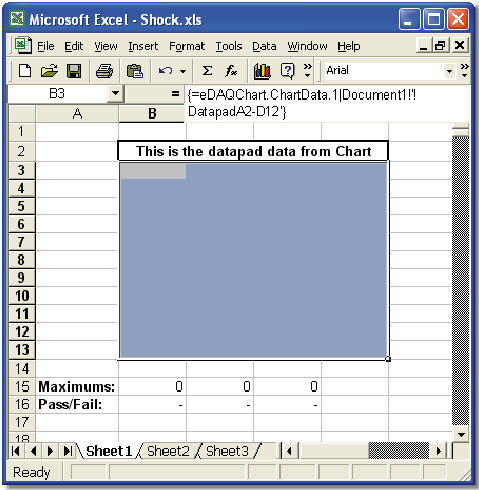
- (download) Figure 6. Data displayed in Data Pad Automatically transfered to Excel.jpg . . 717 × 486 . . 82 KB . . Oliver . . 12:45, 10 July 2013
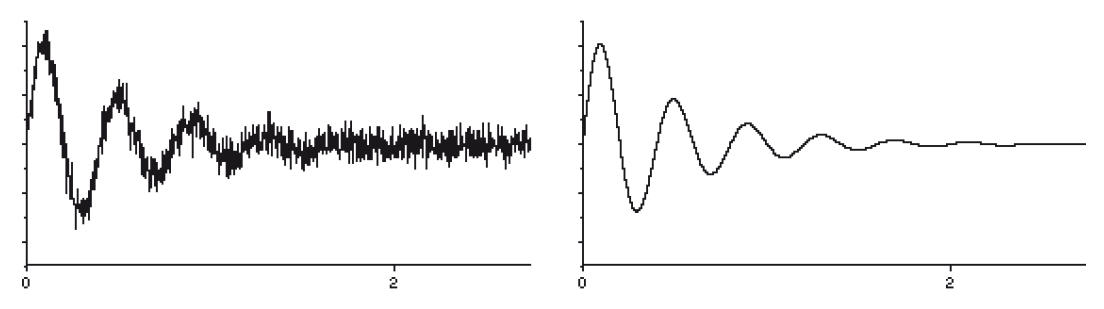
- (download) Figure 6. Noise in a signal (left) can mar the original signal (right), unless filtered out.jpg . . 1,104 × 309 . . 28 KB . . Oliver . . 22:44, 9 July 2013
- (download) Figure 6. Trigger signal on left side of CE instrument.jpg . . 866 × 402 . . 31 KB . . Oliver . . 14:17, 19 July 2013
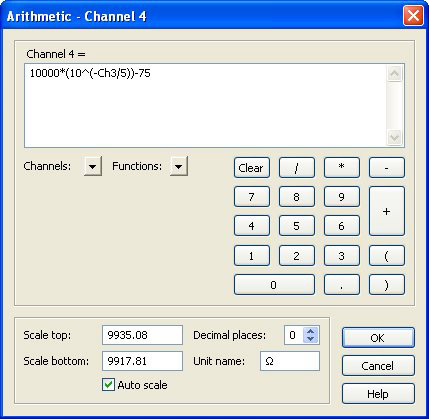
- (download) Figure 6. Use this expression if using 1, 2, 5, 10, 20 kHz Scale Factor.jpg . . 429 × 419 . . 73 KB . . Oliver . . 16:18, 9 July 2013
- (download) Figure 7. A signal viewed with various display settings changed.jpg . . 673 × 465 . . 41 KB . . Oliver . . 22:44, 9 July 2013
- (download) Figure 7. Flow during Initial-Separation Step.jpg . . 491 × 173 . . 27 KB . . Oliver . . 18:16, 8 July 2013
- (download) Figure 7. Pasting link as a picture.jpg . . 512 × 325 . . 30 KB . . Oliver . . 12:45, 10 July 2013
- (download) Figure 7. Series Resistance expression, assuming Vc is monitored.jpg . . 429 × 419 . . 74 KB . . Oliver . . 16:18, 9 July 2013
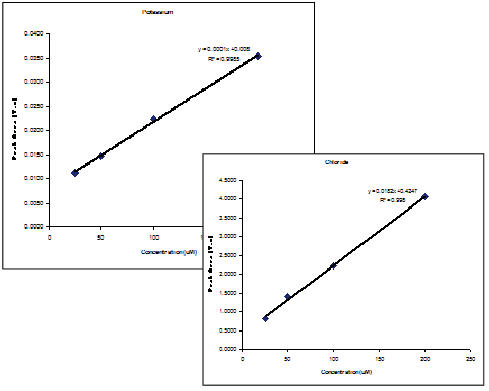
- (download) Figure 8. Calibration curves for potassium and chloride.jpg . . 489 × 391 . . 22 KB . . Oliver . . 20:52, 8 July 2013
- (download) Figure 8. Flow during Injection Step.jpg . . 490 × 173 . . 28 KB . . Oliver . . 18:16, 8 July 2013
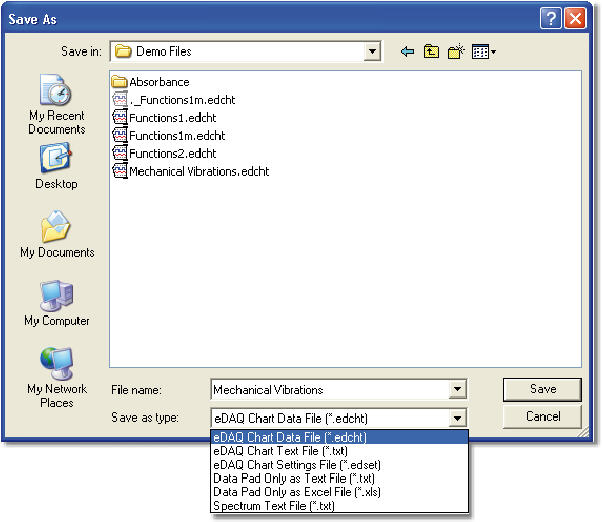
- (download) Figure 8. The “Save As...” dialog box.jpg . . 602 × 522 . . 55 KB . . Oliver . . 12:45, 10 July 2013
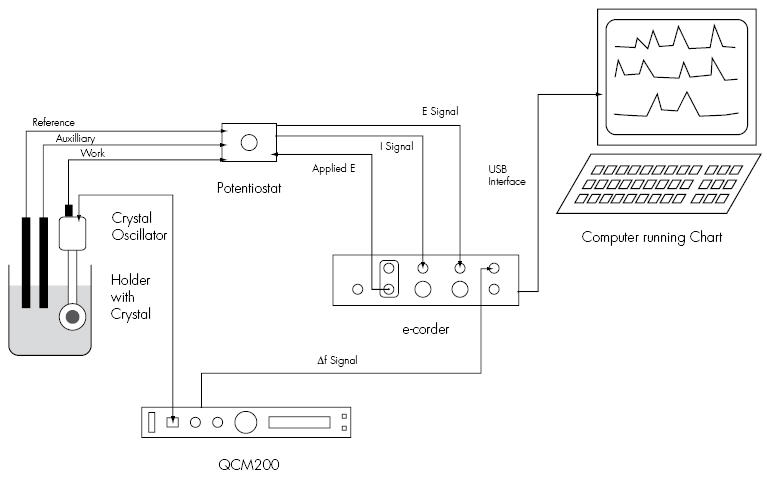
- (download) Figure 8. e-corder and Potentiostat setup for EQCM work.jpg . . 767 × 487 . . 39 KB . . Oliver . . 16:18, 9 July 2013
- (download) Figure 9. Chart data saved as a QuickTime™ movie using the “Save Selection” command.jpg . . 581 × 528 . . 52 KB . . Oliver . . 13:37, 10 July 2013
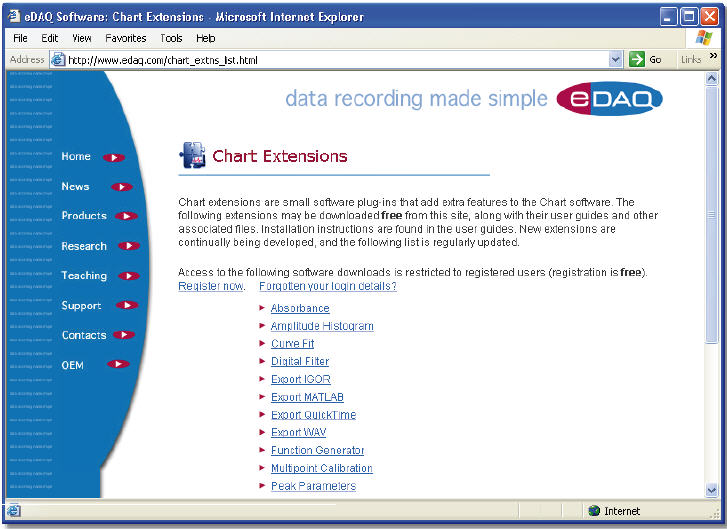
- (download) Figure 9. The eDAQ website has many free Chart Extensions.jpg . . 727 × 529 . . 80 KB . . Oliver . . 12:45, 10 July 2013
- (download) Galvanostat mode3.jpg . . 80 × 49 . . 2 KB . . Oliver . . 17:33, 29 May 2013
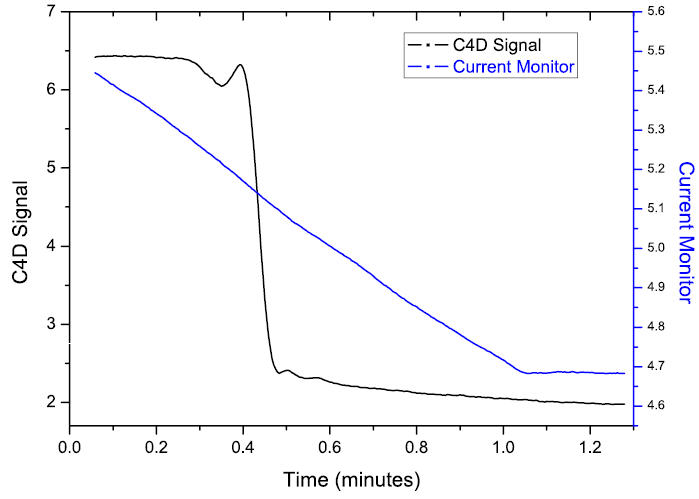
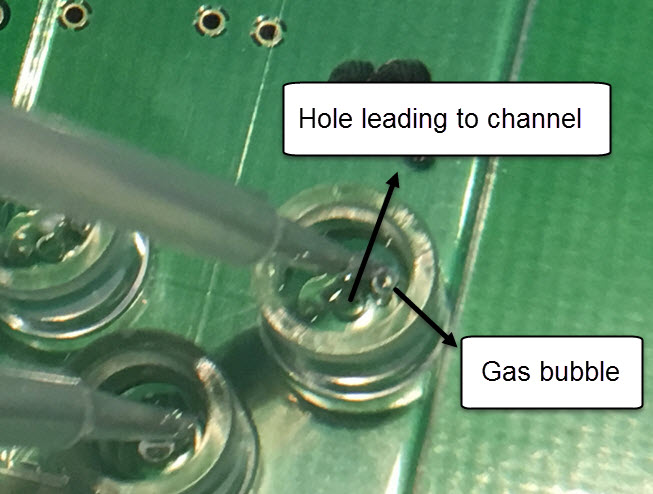
- (download) Gas bubble in chip reservoir.jpg . . 653 × 494 . . 57 KB . . Oliver . . 18:33, 19 December 2016
.jpg)
_can_mar_the_original_signal_(right),_unless_filtered_out.jpg)