Search results
Create the page "$1" on this wiki! See also the search results found.
Page title matches
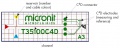
File:Figure 1. Microchip nomenclature.jpg (977 × 388 (84 KB)) - 18:15, 8 July 2013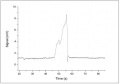
File:Figure 5. Anions overloading at 1 mM concentration.jpg (487 × 342 (13 KB)) - 18:15, 8 July 2013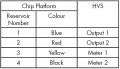
File:Table 1. Connecting the Chip Platform to the HVS.jpg (556 × 322 (29 KB)) - 18:16, 8 July 2013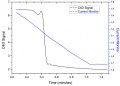
File:Figure 1. Electropherogram for one run..jpg (699 × 499 (36 KB)) - 19:46, 8 July 2013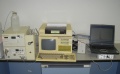
File:Figure 1. Shimadzu SPD-6A UV detector.jpg (955 × 586 (67 KB)) - 23:45, 8 July 2013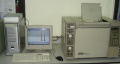
File:Figure 1. The PowerChrom System connected to the HP5890.jpg (956 × 509 (63 KB)) - 23:54, 8 July 2013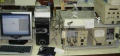
File:Figure 1. The ER280 PowerChrom System connected to a Waters HPLC.jpg (960 × 447 (90 KB)) - 00:07, 9 July 2013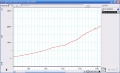
File:Figure 1. The Chart software gives a continuous live display of the gas concentration.jpg (958 × 580 (124 KB)) - 00:45, 9 July 2013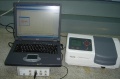
File:Figure 1. e-corder connected to Jenway 6300 spectrophotometer.jpg (888 × 587 (83 KB)) - 00:51, 9 July 2013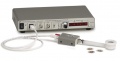
File:Figure 1. SRS QCM200 Quartz Crystal Microbalance.jpg (911 × 461 (68 KB)) - 16:18, 9 July 2013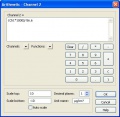
File:Figure 6. Use this expression if using 1, 2, 5, 10, 20 kHz Scale Factor.jpg (429 × 419 (73 KB)) - 16:18, 9 July 2013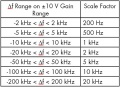
File:Table 1. delta f ranges and suitable Scale Factors.jpg (599 × 434 (54 KB)) - 16:52, 9 July 2013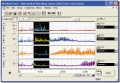
File:Figure 1. A selection of Chart data.jpg (687 × 473 (109 KB)) - 12:45, 10 July 2013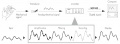
File:Figure 1. A summary of data acquisition using an e-corder system.jpg (1,005 × 369 (45 KB)) - 22:44, 9 July 2013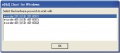
File:Figure 1. Select e-corder dialog box.jpg (867 × 381 (46 KB)) - 14:09, 10 July 2013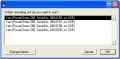
File:Figure 1. Select recorder window.jpg (959 × 471 (80 KB)) - 14:27, 10 July 2013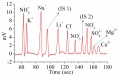
File:Simultaneous separation of a standard mixture of cations and anions, (cationic IS 1) Imidazole, (anionic IS 2) ClO4-.jpg (2,924 × 1,835 (301 KB)) - 18:47, 26 August 2013


_Imidazole,_(anionic_IS_2)_ClO4-.jpg)