Electro-osmotic Flow Measurement in a Microfluidic Chip
The electro-osmotic flow (EOF) in a microfluidic chip was investigated by monitoring the current through the channel and by using contactless conductivity detector.
Contents
Introduction
The electro-osmotic flow (EOF) in a poly(dimethylsiloxane) (PDMS) microfluidic chip was investigated, by using both the current monitoring method and by a capacitively-coupled contactless conductivity detector (C4D). The PowerChrom software from eDAQ was used to record and analyze the data. The methodology reported here is applicable to any capillary electrophoresis experiment, including traditional capillary electrophoresis with fused silica capillaries.
This original research was conducted by Qian Guan and Dr. Charles S. Henry at the Department of Chemical and Biological Engineering, Colorado State University. qian.guan@colostate.edu
Equipment Required
- ER225 C4D Data System
- ET225 Micronit Chip Electrophoresis Platform
- Computer with the latest PowerChrom software
- Background electrolyte (BGE): 20 mM and 18 mM boric acid (pH 9.20). Not required to use boric acid; just need two solutions with different ionic strengths.
- Poly(dimethylsiloxane) (PDMS) microchips with a straight channel connected by two reservoirs. Channel dimension: 4.75 cm long, 50 μm wide, 50 μm high.
- A purpose-built high voltage sequencer (HVS). Can use ER430 High Voltage Sequencer
The ER280 PowerChrom System, obsolete EA120 C4D Amp and obsolete ET121 Platform were used for this application note
Conditions
The results in this application note were obtained using the following conditions:
- High voltage: +881 V
- C4D settings:
- Frequency = 500 kHz
- Amplitude = 100 %
- Headstage gain ON
Experimental Setup
The delta K signal from the C4D Amp was connected to input 1 of the PowerChrom unit. The current monitor was connected to input 2 of the PowerChrom unit. This enable both the C4D and current signals to be displayed simultaneously in the PowerChrom software.
Electro-osmotic Flow Measurement using the Current Monitoring Method
The current monitoring method for EOF measurements was described previously (Huang, X., Gordon, M. J., Zare, R. N., Anal. Chem. 1988, 60, 1837–1838). Briefly, the first reservoir and the channel are filled with 20 mM BGE and the second reservoir is filled with 18 mM BGE. Upon application of high positive voltage in the first reservoir, EOF causes the lower concentration electrolyte solution to gradually displace the higher concentration BGE in the channel, resulting in an increase in the electrical resistance of the channel. The change in separation current under a constant applied voltage difference is monitored. Once a constant current is obtained, the potential is reversed and the above procedure repeats.
The time required to reach a current plateau is used to calculate EOF based on Equation 1, where L is the length of the separation channel, V is the total applied voltage, and t is the time in seconds required to reach the new current plateau.
μEOF = L2/Vt Equation 1
Electro-osmotic Flow Measurement using the C4D
The microchip is set up for a close contact with the C4D microfluidic platform by spring screws. The desired detection point in the microchip channel is located at the center position between two detection electrodes on the surface of C4D microfluidic platform. The BGE loading and voltage control in this method is the same as that described in the current monitoring method and the two methods can be run at the same time.
It is generally recommend to use a microchip which has a bottom sheet with a thickness no higher than 0.5 mm, to obtain highly sensitive conductivity detection. Do not move or touch C4D microfluidic platform during experiments to avoid creating noise.
The time required to reach a sharp conductivity change from the beginning stable status is monitored using the C4D Amp. EOF is calculated based on Equation 2 where L’ is the distance between the reservoir where EOF starts flow and the detection point, and the other parameters are the same as those in Equation 1.
μEOF = L’L/Vt Equation 2
Results
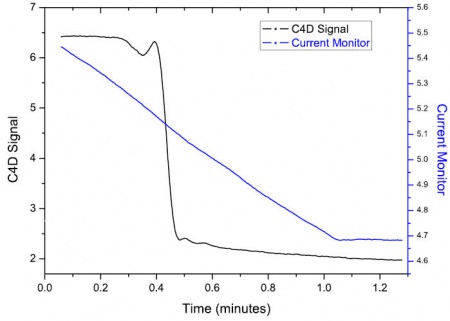
Figure 1 shows electropherograms for EOF measurements using both the current monitoring method (blue plot) and C4D (black plot).
The current monitoring method gives the average conductivity along the channel, as the channel is filled with the BGE of lower concentration. This produces a gradual decrease in the current monitor, until the whole channel is filled with the BGE of lower concentration, and a plateau is reached.
The C4D signal gives a conductivity measurement at a particular point along the channel, and thus there is a sudden decrease in conductivity, when the BGE of lower concentration reaches the position of the C4D electrodes.
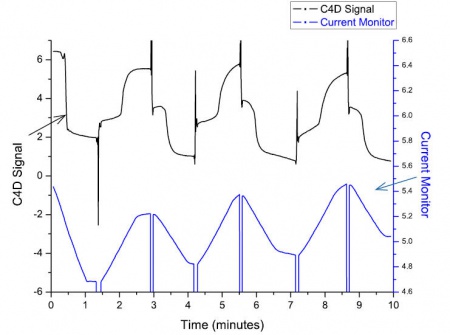
Figure 2 shows the electropherogram of all the data, where the voltage is applied first in one direction, and then is reversed to make the EOF travel in the opposite direction along the chip’s channel. This is repeated a number of times.

