Plotting the IV Curve of a Solar Cell in EChem Software
This application note describes a procedure for plotting the IV curve of a solar cell using eDAQ EChem software.
Contents
Introduction
The linear sweep voltammetry technique in EChem software can be used to plot the IV (current versus voltage) curve of a solar cell. The software can then overlay many IV curves recorded under different conditions. The EChem Startup System is an inexpensive, easy to use system for characterising solar cells.
Background
The development and testing of solar cells (and other power generation/storage devices such as batteries, capacitors, and fuel cells) requires characterisation of the performance of the device under different load conditions. In days gone by this was usually done by connecting an electrical resistor (which mimicked an actual load) to the device while the voltage and current were measured. This was repeated for different values of resistor over the range of interest, which could mean that many resistors would be required.
Ohm's Law tells us that current is proportional to voltage divided by resistance, that is i = V/R, or put another way, if we know i and V than we can calculate R (using R = V / i).
Using a device called a potentiostat, we can control voltage and simultaneously measure the current. This means that a potentiostat can be used to characterise a solar cell by changing the potential across the cell and measuring the resulting current, and so can quickly determine the electrical characteristics for a large number of resistance values.
Equipment Required
The following equipment is required:
- Computer with EChem software installed
- ER466 Integrated Potentiostat, or EA163 Potentiostat with e-corder
- ET325 Thin film solar cell
- ET067 Lead Wire Clamp or a holder for the solar cell
- A light source or solar simulator
Procedure
Prepare the Solar Cell and Light Source
- Prepare the ET325 Thin film solar cell by removing the protective plastic coating on the electrical contacts of the solar cell. This can be done by scratching the plastic coating with a sharp knife, or with a soldering iron as shown in Video 2.
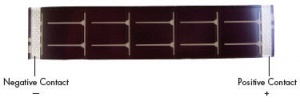
- Connect the electrode cable of the potentiostat to the solar cell. You get the correct polarity by connecting as follows: working electrode (green clip) to the positive contact of the solar cell and auxiliary and reference electrodes (red and yellow clips) to the negative contact of the solar cell. The positive and negative contacts are shown in Figure 1, and can be distinguished by the silver markings on the solar cell. If you think of the markings as a series of bridges, the top of the each bridge is towards the positive contact and the legs of the bridge point towards the negative contact.
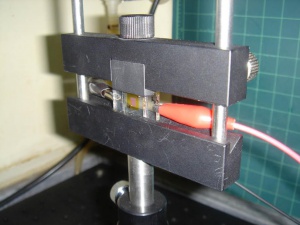
- Lay the solar cell on a flat surface. You can use the ET067 Lead Wire Clamp to hold the electrode cable in place.
- Set up the light source to shine on the solar cell.
Determine the Open Circuit Potential (VOC) of the Solar Cell
- Turn on the potentiostat and open the EChem software.
- In the Technique menu, select “Linear Sweep”.
- In the top right corner of the window, select a Range of 10 V. Click OK.
- Click the Potentiostat box on the right of the screen, under the current range, to open the Potentiostat Window.
- Turn on your light source to illuminate the solar cell.
- Change the Cell to Real. You may see a change in the recorded current, displayed the towards the top left of the window, above the graph.
- Change the current range to a value which is just above the current you are reading. For example, if you are reading a current of 162 µA, select a current range of 200 µA.
- If the current is a negative value, click or unclick the Invert button to get a positive value.
- Set a low-pass filter of 10 Hz.
- The current value is the short-circuit current (ISC) of the solar cell under the light conditions you are using.
- In the bottom left of the window, SLOWLY slide the Applied Potential slider to the right, to apply a positive potential. You should see a reduction in the current.
- You don’t want to apply so much potential that the current becomes a negative value, as this means you using the potentiostat to push a current the wrong way through the solar cell. This can damage the solar cell.
- If the current increases as you increase the potential, you have connected the solar cell the wrong way to the electrode cable; you should set the Cell to Standby and connect the solar cell the opposite way.
- Continue to slide the Applied Potential slider to the right until the current is zero. You can use the arrows to finely tune the potential, or click the "A" button to type in a potential value.
- The potential applied when the current is zero is the open circuit potential (VOC) of the solar cell, at the light intensity you are using. Make a note of it.
- Click OK (do not Cancel, as you want to keep the current range and low-pass filter settings).
Perform an IV Curve
- In the Technique menu chose “Linear Sweep”. In the top right of the window, select a potential range which is slightly higher than the open circuit potential.
- Enter the value of the open circuit potential in “Initial” and zero in “Final”.
- Chose an appropriate rate. Click View to see how long the sweep will take. Click OK and OK again.
- In the Display menu, select “Overlay All”. You can also change the colour of the overlays in the Overlay Display Settings.
- Click Start to perform a scan.
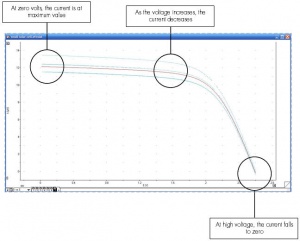
- When the scan is finished, you should obtain an IV curve similar to one of the curves in Figure 2.
- Check to see if the current reaches zero in the bottom right of the IV curve; if the current is always positive and never reached zero, you must increase the “initial” value in the Linear sweep window; if the current falls a lot below zero, do the opposite by decreasing the “initial” value, as this may damage your solar cell.
- Repeat scan under different light conditions. You may need to:
- Alter the “Initial” Potential of the linear sweep voltammetry settings, as the open circuit potential may change with different light conditions.
- Alter the current range, as the short-circuit current may also change with different light conditions.
Notes
- You can copy and paste the voltage and current values, or the IV picture, into third party software using the Copy Special command in the Edit menu.
- Transfer the voltage and current data of an IV curve to Excel and create new columns for resistance, R = V/i, and work, W = i x V
- Make a graph that shows i, R, and W versus V. Determine the conditions that provide for maximum work by the solar cell.
- Use the Show Overlay command in the Display menu, to overlay the IV curves you have collected; if you would like to delete a scan, use the Cut command in the Edit Menu.


