ES500 Chart and Scope Software

ES500 Chart and Scope Software
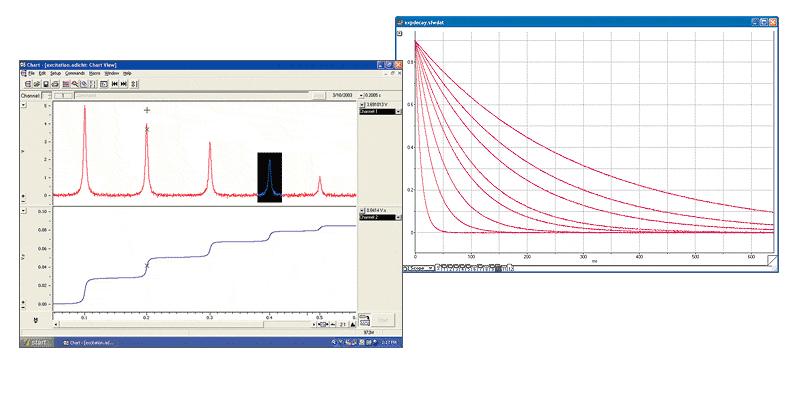
e-corder® is supplied with both Chart and Scope software. Chart software records data continuously to hard disk, on one to four channels (depending on e-corder model). Scope software records data on one or two channels in a series of sweeps.

An example of Chart software
Which software to use?
Use Chart software if you have previously worked with chart recorders or flat-bed plotters. Data is recorded in a series of adjacent blocks, within the one file, as you start and stop recording. You can scroll backwards or forwards through the blocks to review your data.
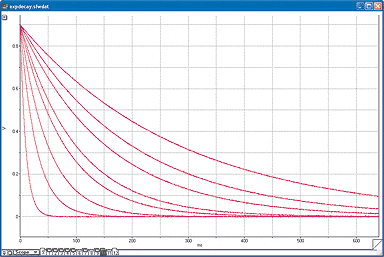
Use Scope software if you have previously worked with XY or XYT plotters, or oscilloscopes. Data is recorded in a series of sweeps (or 'pages' ) within the one file. These sweeps can be overlaid to compare results from one sweep to the next. You can even average the signal from successive sweeps to increase signal-to-noise levels.
Chart and Scope software have many features in common, so as you use one program you gain experience in using the other! Both programs can graphically display data in a number of ways: use the Zoom Window to expand a selection of data; overlay data from different channels; or use XY plotting to graph the data on one channel versus the data on a second channel.

An example of Scope software
Advanced Features
Both Chart and Scope software have many advanced features for recording and analyzing data, some of which are listed below.
-
the Data Pad
The Data Pad is an internal spreadsheet that can extract various parameters (mean, standard error, slope, maximum and minimum values etc.) from selections of your raw data. It can be very useful as the preliminary tool for processing your results. -
the Notebook
The Notebook is a convenient place to make observations about your experiment and to record experimental details - much as you would in any laboratory notebook. Notebook contents are stored with your data file and can be printed, or copied to other documents, when required. -
Comments (Chart) and Page Comments (Scope)
Add comments to a data file to annotate results and locate events of interest when the data is analyzed. Use comments to record external conditions (such as temperature), or events (such as reagent addition), at specific times during the experiment. -
Computed Input
Computed Inputs process signals in real time as they are recorded. -
Copy & Paste
Cut, Paste, and Copy commands are used to export data to other spreadsheets, word processors, or graphing software. -
Triggering
Pre- and post-triggering are amongst the many trigger options. Also trigger from the external trigger input or from any of the signals on the various channels. -
Stimulator Output
Generate waveforms and pulses at the analog outputs of the e-corder unit. Pulses can be used to trigger external equipment such as pumps, heaters, or motors. -
Menu Editor
Hide or lock various commands to simplify software appearance. Ideal for student lab classes or routine technician usage. You can save your preferences as Settings files. -
Macros
Use Macros to perform a succession of software commands to automate data collection and/or analysis. -
Virtual Channels (Chart software only)
Data can be transformed using the many functions available in Chart software. Results can be displayed graphically on unused channels (up to 16 channels can be simultaneously displayed). -
Curve Fitting (Chart software only)
The signal can be fitted with mathematical function of time, y = f(t). Standard equations include polynomials, single and double exponentials, logistic, hyperbolic, Gaussian, and Lorentzian waveforms. User-defined functions can also be used. -
Mathematical transformations
Examples of mathematical transformation of data using the analysis features of Chart or Scope software include:- Smoothing (Savitzky-Golay, or triangular weighting)
- Digital filtering (low pass, high pass, band stop, notch, band pass)
- Channel arithmetic (e.g. channel 3 = channel 1 + channel 2)
- Fourier transformations (Power Spectrum analysis)
- Differentiation and Integration
- Frequency determination, or counting, of pulses or periodic waveforms
- Peak calculations (areas, risetimes, heights above baseline etc.)
- RMS power calculations
Research Areas
- Biosensors
- Biotechnology
- Carbon Dioxide
- Conductivity
- Displacement
- Dissolved Oxygen
- Electrochemistry
- Flow Injection Analysis FIA
- Fluid Flow
- Force and Load
- Microchip Electrophoresis
- Microdialysis
- Neurochemistry
- Nitric Oxide NO
- pH and Ion Selective Electrodes
- Pressure
- Solar and Fuel Cells
- Temperature
- Vibration
Application Notes
FREE Software Trial
To obtain a temporary 4 week license to evaluate eDAQ software, please send your request to info@edaq.com


