Using the SRS QCM200 Quartz Crystal Microbalance with an e-corder
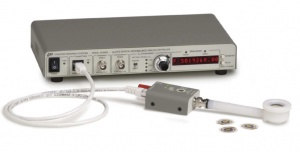
Use a Stanford Research Systems QCM200 Quartz Crystal Microbalance with an e-corder to perform QCM experiments, including Electrochemical Quartz Crystal Microbalance (EQCM) experiments.
Contents
Introduction
The QCM200 System is a Quartz Crystal Microbalance (QCM) manufactured by Stanford Research Systems Inc. It measures the resonant frequency and series resistance of a 5 MHz, AT-cut quartz crystal. Resonant frequency changes as a linear function of the mass of material deposited on the crystal surface.
The instrument outputs an analog signal proportional to relative frequency (Δf) and a signal proportional to conductance (Vc). The Vc signal is related to the series resistance of the crystal and solution viscosity.
This application note describes the procedure to monitor relative frequency (Δf) and mass displacement (Δm) on an e-corder. It also describes the setup to perform Electrochemical Quartz Crystal Microbalance (EQCM) techniques with an eDAQ EA163 Potentiostat and e-corder, or an eDAQ ER466 Potentiostat.
QCM Experiments
Set up the QCM200 and QCM Probe as per instructions in the Operation and Service Manual supplied with the system.
For immersion experiments, secure the QCM Probe to a retort stand and insure that the reaction vessel is big enough and has enough solution to immerse the head of the QCM Probe.
To monitor the Δf signal, connect a BNC to BNC cable from Frequency Analog Out on the rear of the QCM200 to an e-corder input (See Figure 2), or to ER466 Potentiostat Input 1.
If you also wish to monitor Vc, connect a BNC to BNC cable from the Conductance Output on the front of the QCM200 to a spare e-corder input (See Figure 3), or to ER466 Potentiostat Input 2.
Chart Settings and Calibration
In Chart’s rate pop-up menu, select a suitable sampling speed for monitoring the processes that will be occurring at the face of the crystal oscillator.
With the head of the QCM probe out of the solution, set the C0 Compensation switch on the front of the QCM200 to HOLD and the ten-turn dial to 8.0 (Dry Operation Setting). See Operation and Service Manual for how to set the optimal C0 for different media.
Press on the PARAMETER Key on the QCM200 to scroll through the LED display menus.
Hold down the VALUE key for 2 seconds whilst in any display menu to (1) set the Frequency Offset to the current Absolute Frequency value (2) Zero the Relative Frequency readings (3) zero the Mass Displacement display and (4) zero the Frequency Analog Out voltage output.
Press PARAMETER until Scale is displayed. The Voltage Scale Factors are displayed in either Hz/V or kHz/V. Press on VALUE to change the Scale Factor. The Scale Factor to choose depends on the largest Δf value expected, noting the QCM200 has a maximum analog output of ±10 V.
Analog Frequency Out [V] = Δf/Scale Factor
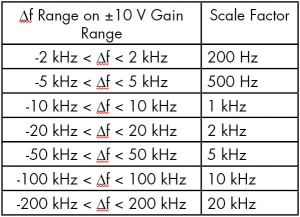
Double the expected maximum Δf and use the values in Table 1 to determine the best Scale Factor to use. Using the narrowest range possible, increases the digital resolution of the measurements.
For a simple immersion test in water, the expected Δf is approximately 715 Hz, so the 200 Hz Scale Factor is the best.
For very small frequency fluctuations, the sensitivity can be further increased by using a narrower e-corder gain range than the default ±10 V range.
Select the Input Amplifier for the Channel connected to the QCM200 Frequency Analog Out. With the Crystal Oscillator in air, the signal should be already zeroed. If not, press the VALUE Key on the front of the QCM200 for 2 seconds. If the signal is noisy, experiment with the various low pass filters.
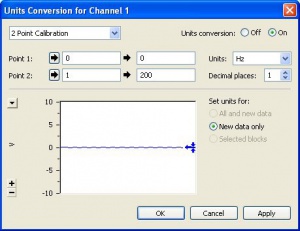
Click on Units... in the Input Amplifier window, to open the Units Conversion window (Figure 4).
For Point 1, enter 0 in the left hand cell, and zero in the right hand cell. For Point 2, enter 1 in the left hand cell, and the Scale Factor selected (200 for the immersion test) in the right hand cell. Define the units as either Hz or kHz, depending on the Scale Factor selected.
Click OK. The channel is now calibrated to read the relative frequency output in either Hz or kHz.
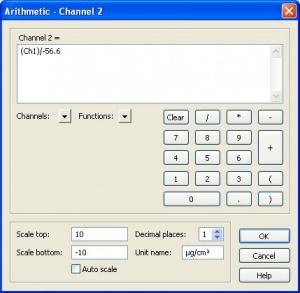
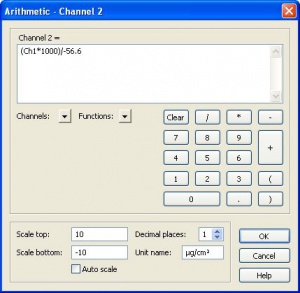
To configure another Channel to directly display mass displacement, select Arithmetic... on the Channel.
The general mass sensitivity equation is
Δf = −Cf × Δm
Where Cf = the sensitivity factor for the crystal (56.6 Hz.µg/cm2 for a 5 MHz crystal at room temperature).
If using the standard 5 MHz quartz crystal supplied with the QCM200 system, enter the expression in either Figure 5 or 6 into the Arithmetic window.
Enter µg/cm2 as the unit name.
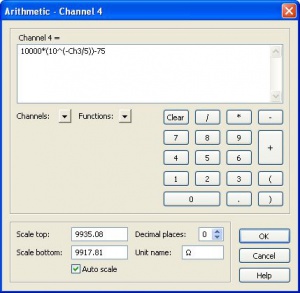
The Conductance Output signal (Vc) in related to the series resistance of the QCM crystal by:
R = 10000 × (10 − Vc/5) − 75
Enter this expression in into the Arithmetic window of a spare channel to record series resistance directly (See Figure 7). Define the unit name as Ω (Ohms).
The e-corder system is now set up to record relative frequency, mass displacement and series resistance of the QCM simultaneously. Click on start to begin recording data and perform your experiments.
Note, other parameters such as temperature an pH can be monitored on other channels with suitable amplifiers and transducers.
EQCM Experiments
In EQCM experiments, a potential is applied to the gold surface of the quartz crystal oscillator, and the change in mass near the surface and current from electrochemical processes are monitored simultaneously.
To perform EQCM techniques, set up the ER466 Potentiostat, or the EA163 Potentiostat and e-corder with four or more channels, as per instructions in their respective hardware manuals. Reference and auxiliary electrodes are also required, as found in the ET014 EChem Electrode Kit.
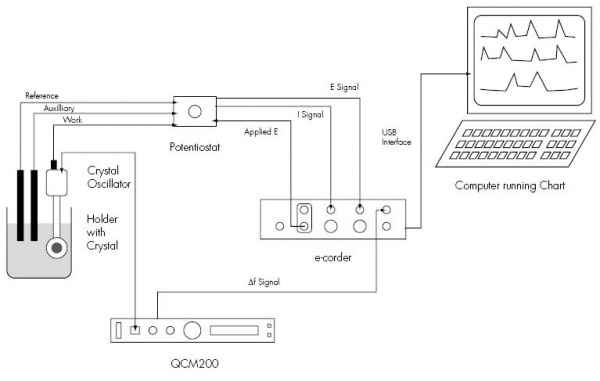
Connect the green working electrode cable from the Potentiostat to the Crystal Face Bias connector on the QCM25 Crystal Controller, using a banana plug adapter. Connect the yellow cable to your reference electrode, and the red cable to your auxiliary electrode.
Figure 8 shows a typical setup for EQCM work.
Techniques
Chart software is used for EQCM experiments. You will need to consult the Chart Software Manual for more details.
For amperometric (current versus time) techniques, a fixed potential can be set in the Chart software Stimulator menu.
For cyclic voltammetry techniques a potential ramp can be defined in the Chart software Stimulator menu (Up & Down, and Triangle items). If greater versatility of the applied potential is required (eg arbitrary start and end potentials, manual ramp interrupt or ramp reversal) an ER175 Waveform Generator can be used.
Chart typically displays signals (current, potential and QCM ∆f) all versus time. To create a traditional votammogram, current (and ∆f) versus potential use the XY View option in the Chart Software (see manual).
Sections of the current signal can be integrated (wth respect to time) to estimate the amount of charge transferred. This should correspond to the amount of electrolysed sample which in turn should be proportional to to the amount of material deposited, or removed, from the QCM electrode. See the Chart Software Manual for methods for reporting an integrated quantity, such as Computed function: Integral, Integral Channel command, and the integral functions in the Data Pad.
To get publication–ready diagrams it is usually best to copy and paste selected parts of the signal to specialist graphing software such as Origin or Igor Pro, or even Microsoft Excel.
