Difference between revisions of "非接触電導度検出法による微生物増殖のモニタリング"
(→使用する装置) |
(→Experiment) |
||
| Line 20: | Line 20: | ||
* [Http://www.edaq.com/ES500 Chart ソフトウェア]をインストールしたコンピュータ、または独自の記録ソフトウェア(例、Tera Term、LabVIEW、 C#, WinWedge や HyperACCESS) | * [Http://www.edaq.com/ES500 Chart ソフトウェア]をインストールしたコンピュータ、または独自の記録ソフトウェア(例、Tera Term、LabVIEW、 C#, WinWedge や HyperACCESS) | ||
| − | === | + | === 測定 === |
| − | + | 適温でバクテリアを細増させると、無電荷または弱電荷の基質(酵母、ペプトン、糖など)が高電荷の終末代謝物(アミノ酸、アルデヒド、ケトン、酸など)に変換され、イオン濃度の変化や媒体の導電度の増加を招きます。この変化をC4Dでモニタリングすることで、バクテリアの増殖プロセスを知ることができます。図2は電磁信号で励起し記録するC4D電極をピンク色で示したものです。The growth of bacteria, at the desired temperature, transforms the uncharged or weakly charged substrates (e.g. yeast, peptone, and sugar) into highly charged end products, such as amino acids, aldehydes, ketones, acids, and other metabolites, causing a change in the ionic concentration, increasing the conductivity of the medium. This is monitored with the C4D, allowing to characterise the process of bacterial growth. This is shown in Figure 2. The C4D electrodes, applying and recording the electromagnetic signal, are shown in pink. | |
[[File:Typical curve of E. coli growth in LB medium.jpg|200px|thumb|right|Figure 3. A typical curve of E. coli growth in LB medium; blue (E. coli) and red (control)]] | [[File:Typical curve of E. coli growth in LB medium.jpg|200px|thumb|right|Figure 3. A typical curve of E. coli growth in LB medium; blue (E. coli) and red (control)]] | ||
| + | |||
=== Results === | === Results === | ||
==== Characterize Growth of Escherichia Coli ==== | ==== Characterize Growth of Escherichia Coli ==== | ||
Revision as of 16:26, 11 October 2023

Contents
要約
非接触電導度検出法(C4D)を用いて多検体に対応する微生物増殖センサー(EBGS)を開発しました。8本のディスポーザブルのNMR用チューブに大腸菌(E. coli)の培養サンプルを入れ非接触電導度検出器を用いてモニターし、電導度を培養時間に対してプロットすることにより高解像度の増殖曲線が得られました。ここでの大腸菌の増殖速度の結果は、光学的濃度計や接触式電導度法で補助的な装置も必要なく、付加的な化学薬品や生体材料も使いません。従いましてこの測定法は簡単な操作でしかも精度・再現性も高く、小型で多用途に活用できコストオパフォーマンスに優れた測定器です。
はじめに
バクテリアの増殖の性質を理解することは、医学研究、臨床診断、食品の安全性、発酵産業や環境のモニタリングなど多くの分野において大変重要な意義を持っています。これには増殖速度、共存する化学物質のストレス効果や毒性の影響、生理活性などが含まれます。増殖ベースの測定は、抗菌感受性試験の「ゴールドスタンダード」メソッドであり、遺伝子レベルでの生命の進化を研究するためにも用いられています。
バクテリアの増殖を特性付けるための様々な技術が確立されています。プレートカウント法およびPCR(ポリメラーゼ連鎖反応)法は正確で再現性がありますが、手間が掛かります。オンラインモニタリング法も開発されており、例えば濁度、イメージング、蛍光、回折、反射などの光学ベースのパターンを使用しています。インピーダンスセンサーなどの電化学法は、バクテリアの増殖をモニタリングする非常に有望な選択技法ですが、作業電極は媒体と電気的に接触しなければならないため、電極の劣化や非特異的反応が避けられません。これによって精度が低下し誤測定を招く恐れがあります。
このアプリケーションノートでは、C4D(容量結合式非接触導電度検出)を用いて微生物の増殖をオンラインでモニタリングし、従来の電気式や電気化学法が持つ諸問題を解決し、同時にプレートカウント法やPCR法と同等の精度を持ちハイスループット測定を実現する方法を紹介示します。
使用する装置
- ER818 8チャンネル電導度システム、内訳:
- ER815 電導度検出器
- ET128 8組のC4Dヘッドステージ、図 1は8本のバクテリア培養管を各C4Dヘッドステージの中に挿入した画像です。
- Chart ソフトウェアをインストールしたコンピュータ、または独自の記録ソフトウェア(例、Tera Term、LabVIEW、 C#, WinWedge や HyperACCESS)
測定
適温でバクテリアを細増させると、無電荷または弱電荷の基質(酵母、ペプトン、糖など)が高電荷の終末代謝物(アミノ酸、アルデヒド、ケトン、酸など)に変換され、イオン濃度の変化や媒体の導電度の増加を招きます。この変化をC4Dでモニタリングすることで、バクテリアの増殖プロセスを知ることができます。図2は電磁信号で励起し記録するC4D電極をピンク色で示したものです。The growth of bacteria, at the desired temperature, transforms the uncharged or weakly charged substrates (e.g. yeast, peptone, and sugar) into highly charged end products, such as amino acids, aldehydes, ketones, acids, and other metabolites, causing a change in the ionic concentration, increasing the conductivity of the medium. This is monitored with the C4D, allowing to characterise the process of bacterial growth. This is shown in Figure 2. The C4D electrodes, applying and recording the electromagnetic signal, are shown in pink.

Results
Characterize Growth of Escherichia Coli
Figure 3 shows a typical bacterial growth curve of E. coli growth in LB medium; the blue line shows E. coli in LB medium, while the red line is the control showing pure LB medium. The normalized apparent conductivity value (NACV) is plotted against the incubation time over a period around 45000 s (12.5 h). It is a classical S-shaped curve similar to those obtained with other methods.
Quantitative Determination of Viable Escherichia Coli
Figure 4 shows the conductivity plots of E. coli with different initial inoculum (in CFU Colony-Forming Unit values) as a function of incubation time. The linear relationship between the logarithmic values of initial inoculum of E. coli and detectable times is showed in Figure 5. This suggests that the proposed C4D method can also be used to rapidly quantify target bacteria based on the growth kinetics, just like when using optical, PCR, calorimetry or other electrochemical methods, although the conductivity responses cannot indicate the cell concentration directly.
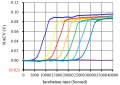
Figure 4. Plots of conductivity of different initial inoculum (CFU Colony-Forming Unit)
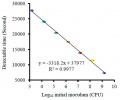
Figure 5. The linear relationship between initial inoculum and detectable times
_of_Escherichia_coli.jpg)


Study of Stress Effect of Salinity on Escherichia Coli Growth
The bacterial growth is often effected by many environmental factors, such as salinity, temperature and pH. In order to elucidate the capacity of the EBGS method for these kinds of investigations, salinity gradient was used to probe E. coli growth. Figure 6 shows a typical growth curves of E. coli growth in LB medium, in which the concentration of NaCl is 1.0, 2.0, 3.0 and 4.0 g/L, respectively. Apparently, the higher the concentration of NaCl, the lower the maximum growth rate and the maximum outputs is obtained, due to its inhibition effect on bacterial growth. The result is in agreement with those obtained with conventional optical methods. Of note, there is an interesting phenomenon on the curves – the salinity plays almost little effect on the lag phase.
Reference
Online monitoring of bacterial growth with electrical sensor. Xuzhi Zhang, Xiaoyu Jiang, Qianqian Yang, Xiaochun Wang, Yan Zhang, Jun Zhao, Keming Qu, and Chuan Zhao. Anal. Chem., 2018, 90 (10), pp 6006–6011 DOI: 10.1021/acs.analchem.8b01214