非接触電導度検出法による微生物増殖のモニタリング

Contents
要約
非接触電導度検出法(C4D)を用いて多検体に対応する微生物増殖センサー(EBGS)を開発しました。8本のディスポーザブルのNMR用チューブに大腸菌(E. coli)の培養サンプルを入れ非接触電導度検出器を用いてモニターし、電導度を培養時間に対してプロットすることにより高解像度の増殖曲線が得られました。ここでの大腸菌の増殖速度の結果は、光学的濃度計や接触式電導度法で補助的な装置も必要なく、付加的な化学薬品や生体材料も使いません。従いましてこの測定法は簡単な操作でしかも精度・再現性も高く、小型で多用途に活用できコストオパフォーマンスに優れた測定器です。
Introduction
Insight into the nature of bacterial growth is of fundamental significance in many fields, such as medicine research, clinical diagnosis, food safety, fermentation industry and environmental monitoring. This includes the speed of proliferation, stress and/or toxic effect of coexistent chemicals, and physiological activities. Growth-based measurement is still the ‘gold standard’ method for antimicrobial susceptibility testing and is employed to study the life revolution at gene level.
Various techniques for charactering the bacterial growth have been established. The plate counting and PCR (Polymerase Chain Reaction) methods are accurate and reproducible, but labor-intensive. Online monitoring methods have been developed, for example optical-based patterns, including turbidity, imaging, fluorescence, diffraction and reflectance. Electrochemical techniques such as impedimetric sensors are a very promising choice for monitoring bacterial growth, however, electrode deterioration and nonspecific binding are unavoidable since the working electrodes must be in galvanic contact with the medium. This results in erratic measurements that decrease the accuracy.
This application note shows how C4D (capacitively-coupled contactless conductivity detection) can be used to solve problems faced by traditional electrical and electrochemical methods for online monitoring bacterial growth, as well as to realize automatic high-throughput measurement while equalling the plate counting and PCR methods in precision.
Equipment Required
- ER818 Octal Contactless Conductivity System, which includes:
- ER815 Contactless Conductivity Detector
- ET128 Octal headstage, Figure 1 shows a photograph of the headstage of the eight- channel C4D, with eight bacterial culture tubes inserted in.
- A computer with Chart software or your own software to record the data (for example, Tera Term, LabVIEW, C#, WinWedge or HyperACCESS)
Experiment
The growth of bacteria, at the desired temperature, transforms the uncharged or weakly charged substrates (e.g. yeast, peptone, and sugar) into highly charged end products, such as amino acids, aldehydes, ketones, acids, and other metabolites, causing a change in the ionic concentration, increasing the conductivity of the medium. This is monitored with the C4D, allowing to characterise the process of bacterial growth. This is shown in Figure 2. The C4D electrodes, applying and recording the electromagnetic signal, are shown in pink.

Results
Characterize Growth of Escherichia Coli
Figure 3 shows a typical bacterial growth curve of E. coli growth in LB medium; the blue line shows E. coli in LB medium, while the red line is the control showing pure LB medium. The normalized apparent conductivity value (NACV) is plotted against the incubation time over a period around 45000 s (12.5 h). It is a classical S-shaped curve similar to those obtained with other methods.
Quantitative Determination of Viable Escherichia Coli
Figure 4 shows the conductivity plots of E. coli with different initial inoculum (in CFU Colony-Forming Unit values) as a function of incubation time. The linear relationship between the logarithmic values of initial inoculum of E. coli and detectable times is showed in Figure 5. This suggests that the proposed C4D method can also be used to rapidly quantify target bacteria based on the growth kinetics, just like when using optical, PCR, calorimetry or other electrochemical methods, although the conductivity responses cannot indicate the cell concentration directly.
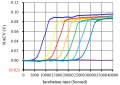
Figure 4. Plots of conductivity of different initial inoculum (CFU Colony-Forming Unit)
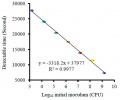
Figure 5. The linear relationship between initial inoculum and detectable times
_of_Escherichia_coli.jpg)


Study of Stress Effect of Salinity on Escherichia Coli Growth
The bacterial growth is often effected by many environmental factors, such as salinity, temperature and pH. In order to elucidate the capacity of the EBGS method for these kinds of investigations, salinity gradient was used to probe E. coli growth. Figure 6 shows a typical growth curves of E. coli growth in LB medium, in which the concentration of NaCl is 1.0, 2.0, 3.0 and 4.0 g/L, respectively. Apparently, the higher the concentration of NaCl, the lower the maximum growth rate and the maximum outputs is obtained, due to its inhibition effect on bacterial growth. The result is in agreement with those obtained with conventional optical methods. Of note, there is an interesting phenomenon on the curves – the salinity plays almost little effect on the lag phase.
Reference
Online monitoring of bacterial growth with electrical sensor. Xuzhi Zhang, Xiaoyu Jiang, Qianqian Yang, Xiaochun Wang, Yan Zhang, Jun Zhao, Keming Qu, and Chuan Zhao. Anal. Chem., 2018, 90 (10), pp 6006–6011 DOI: 10.1021/acs.analchem.8b01214