Measuring the Conductivity of Melt Water from Arctic Ice Cores
The eDAQ C4D was used to measure the very low conductivity of water melted from ice cores taken from the South Dome in Greenland.
Contents
Introduction
Ice cores enclose a variety climate proxies that are valuable for understanding the past climate of our planet. These proxies include trace gases, salts, dust, stable isotopes and acids. Continuous Flow Analysis (CFA) is a method of measuring these chemical impurities by analyzing the water that derives from melting a certain piece cut from the ice core. The eDAQ C4D was used to measure the conductivity of shallow ice cores taken from the South Dome in Greenland. The results are compared with a bench top conductivity meter and with other detection methods of the CFA system as well.
This original research was conducted in 2014 by Maria Arvaniti, Anders Svensson and Paul Vallelonga from the Centre for Ice and Climate at the Niels Bohr Institute, University of Copenhagen, Denmark:
“Application of Contactless Conductivity Detection to Ice Core Analysis” (2.5 MB pdf, Master’s thesis 2014)
Experimental
The performance of the C4D was tested for discrete measurements of conductivity using standards with a range of conductivity values typically found in ice cores. Various experimental parameters were then investigated and optimised, such as tubing material, tubing inner diameter, C4D frequency and detector response time.
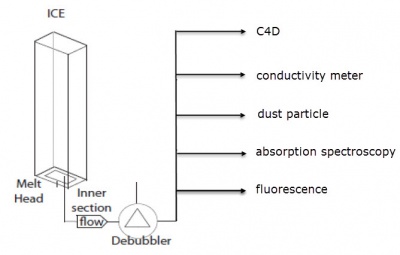
The C4D was then used to measure the conductivity of water melted from an ice core. Figure 2 shows the Continuous Flow Analysis system. The ice core is placed vertically inside the melting unit over a heated melt head. This produces a steady stream of the melted ice core water. This is passed through a dedubbler to remove ancient air trapped in the ice. The water stream is then split and passed through the different detectors:
- Contactless conductivity detector (C4D)
- Benchtop conductivity meter
- Dust particle detector
- Absorption spectroscopy detector
- Fluorescence detector
The absorption and fluorescence detectors are used for detecting the various chemical species incorporated inside the water sample. For example, calcium was detected using the fluorescence detector, while sodium and hydrogen cations were detected using the absorption detector. Conductivity and dust measurements are non-destructive methods used for measuring the bulk conductivity of ions and the dust content in the sample, respectively.
Some of the Equipment Required
- ER225 C4D Data System
- ET131 Configurable C4D Detector/Monitor Headstage; the conductivity of the water from Arctic ice cores is very low, so a modified version of the ET131 was developed to measure conductivity in the range of 100 nS/cm to 20 µS/cm. We now also have a 20 nS/cm to 4 µS/cm version.
- Amber Science Model 3082 Multi-Function Conductivity Meter with 829 Conductivity Micro Flow Cell.
- Tubing: clear perfluoroalkoxy alkane (PFA) tubing with 0.03 inch inner diameter and 0.0625 inch (1/16 inch) outer diameter; tubing with various inner diameters and materials (PEEK and PFA) were tested.
C4D Settings:
- Amplitude = 100% (20 Vpp (Voltage peak-to-peak)).
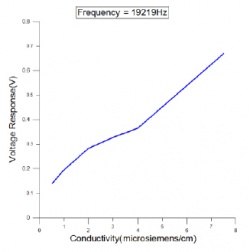
- Frequency = 19.2 kHz, see Figure 3.
Optimizing the Experimental Procedure
Various experiments were carried out to optimize parameters in the setup.
- Tubing inner diameter; tubing with inner diameters of 0.02, 0.03 and 0.04 inches were tested. As expected, the C4D produced a larger signal when using tubing with a larger inner diameter. The larger ID also reduced the back pressure. Tubing with 0.03 inch ID was chosen.
- Tubing material; tubing made from perfluoroalkoxy alkane (PFA) and polyether ether ketone (PEEK) were tested. perfluoroalkoxy alkane tubing was chosen.
- C4D signal response with different frequencies; different C4D frequencies were tested. The frequency of 19.2 kHz was chosen as it showed good linearity between C4D output voltage and conductivity, see Figure 3. The Multipoint calibration feature in the eDAQ Chart software may be used to calibrate such a signal.
- Detector response time; Response time is the time required for an instrument to respond to a sudden step change of the input. It is defined as the time required for the signal of the step function to rise from 5% to 95% of the final output. The C4D showed a faster response in conductivity changes than the benchtop conductivity meter.
Results
Figure 4 shows the conductivity profile for the South Dome ice core between 1960 and 2010. The black lines indicate peaks in both the conductivity and hydrogen cations concentration (not shown).
The conductivity of the South Dome ice core has two outstanding peaks between the years 1980-1990. They are 4-5 times larger than the mean conductivity range of the majority of data, and they match the hydrogen cation peaks recorded for the same years. Volcanic eruptions emit large amounts of gases and aerosols into the atmosphere, especially in the form of sulphuric acid and carbon dioxide. These large amounts of impurities injected into the atmosphere are deposited onto the surface of the ice, producing a higher conductivity signal. It is possible that the two peaks between 1980-1990 are volcanic signals, however, comparison with sulphate detection methods is recommended for further confirmation.
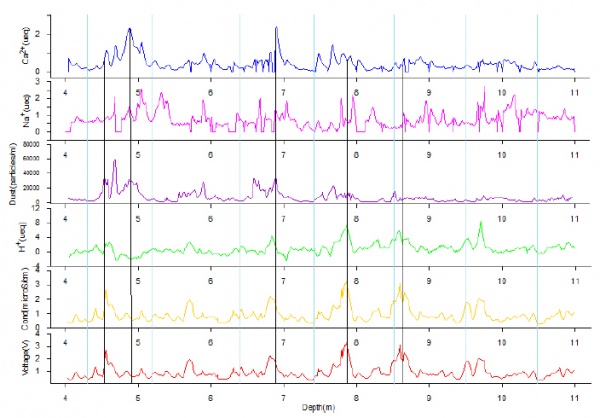
Figure 5 shows results for the ice core from 4-11m depth, which corresponds to the year 2003 (10.5m depth) to 2009 (4.3m depth).
The blue curve is calcium, the violet is sodium, the purple is dust, the green is hydrogen cations, the orange is conductivity measured by the benchtop conductivity meter, and the red is conductivity measured by the C4D detector. The measurements from the eDAQ C4D and the benchtop conductivity meter showed a linear relation with high correlation. The eDAQ C4D exhibits a faster response in conductivity changes than the benchtop conductivity meter.


