Solar and Fuel Cells
The IV curve of a solar cell or small fuel cell can be plotted using the ER466 Integrated Potentiostat System, or e-corder and EA163 Potentiostat, with ES260 EChem software. The EChem software will then overlay IV curves collected under different conditions. Alternatively, the Chart software will calculate and display the power, resistance, total charge and total energy.
The Potentiostat is recommended for cells producing less than 100 mA and also works as a galvanostat. The software will measure the open-circuit potential (VOC) and the short-circuit current of the cell (ISC).
This application note describes the procedure for plotting the IV curve.
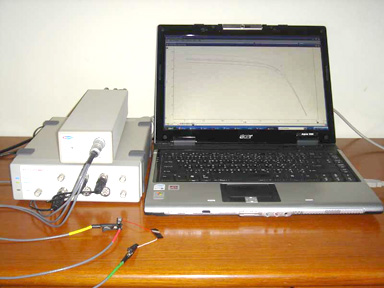
The eDAQ Potentiostat and e-corder is used to plot the IV curve of a simple solar cell
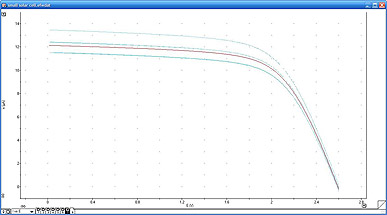
The EChem software will overlay IV curves collected under different conditions

- Potentiostats
- EIS Electrochemical Impedance Spectroscopy
- Contactless Conductivity Detectors C4D
- Separation Science
- PowerChrom Chromatography
- isoPods™ Meters
- Laboratory Data Acquisition
- Battery Research
- SDx Tethered Membranes
- Electrodes, Transducers, Accessories
- Software
- Kits and Bundles
- Complete Product List
- Specials